
Use Case
One of Foglight's big value points is that it lets you go that extra mile. In this post I want to share a specific case where we recently did just that with one of our Foglight Enterprise Customers. The use case was fairly straight forward. The application team wanted an alert when a specific set of processes, on a specific host, crossed a certain threshold. If one process crossed the threshold it was OK but they wanted to be alerted if 2 or more, crossed the set threshold.
This happened to be a good setting where the team could be proactive because they noticed this behavior in a previous outage analysis that they had done with Foglight. Since they know the precursor to the outage they can now trap on it and be truly proactive. The details get a bit deep but the outcome lead us to a certain early detection.
Implementation
The first thing we had to do was to tell Foglight to collect all of the process instances for that host. Usually Foglight only collected aggregate process information. Note, you need to make sure you don’t set this globally because it will create a lot of data. The following screenshot shows me turning the “Report only aggregate process metrics” to False where the default it typically true.
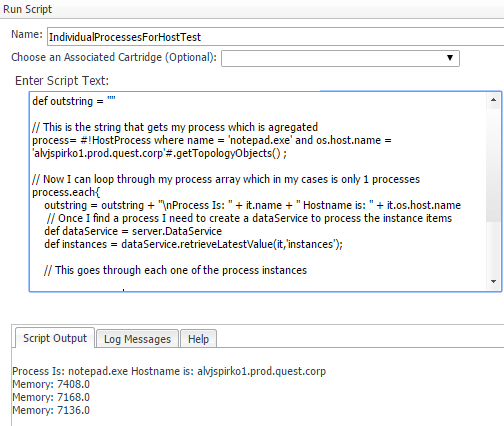
Now we should see instances of each process. Even one that are named the same. This is a test script that you can run to make sure you’re seeing the instance data:
def outstring = ""
// This is the query that gets my process which is aggregated
process= #!HostProcess where name = 'notepad.exe' and os.host.name = 'alvjspirko1.prod.quest.corp'#.getTopologyObjects() ;
// Now I can loop through my process array, which in my cases is only 1 processes
process.each{
outstring = outstring + "\nProcess Is: " + it.name + " Hostname is: " + it.os.host.name
// I need to create a dataService to process the individual instance observations
def dataService = server.DataService
def instances = dataService.retrieveLatestValue(it,'instances');
// Next go through each one of the process instances in the data service and print the memory
instances.each {
it.value.workingSetSize.each {
outstring = outstring + "\n Memory: " + it
}
}
}
return outstring
Your output should look something like this.
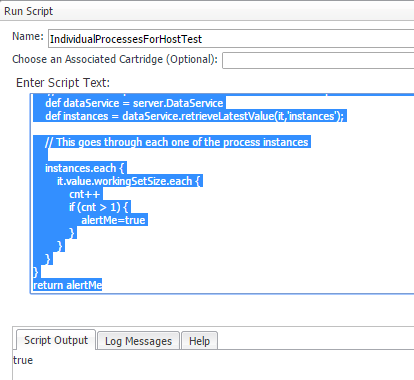
Now we can take what we learned and put it in a rule. So I altered the script to say if 2 of the 3 instances are above 7150 to alert me. This is my script and output.
def outstring = ""
def threshold=7150
def cnt = 0
def alertMe = false
// This is the string that gets my process which is agregated
process= #!HostProcess where name = 'notepad.exe' and os.host.name = 'alvjspirko1.prod.quest.corp'#.getTopologyObjects() ;
// Now I can loop through my process array which in my cases is only 1 processes
process.each{
// Once I find a process I need to create a dataService to process the instance items
def dataService = server.DataService
def instances = dataService.retrieveLatestValue(it,'instances');
// This goes through each one of the process instances
instances.each {
it.value.workingSetSize.each {
if(it > threshold) {
cnt++
if (cnt > 1) {
alertMe=true
}
}
}
}
}
return alertMe
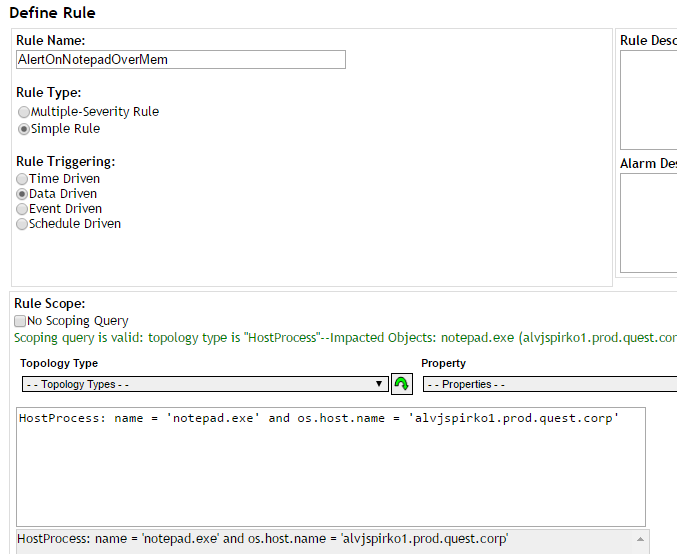
Finally we take the script and put it in a rule. The rule will now fire where 2 or more processes exceeds our set threshold for memory.
Set Rule Scope
The first part of our test script can be used to set scope.
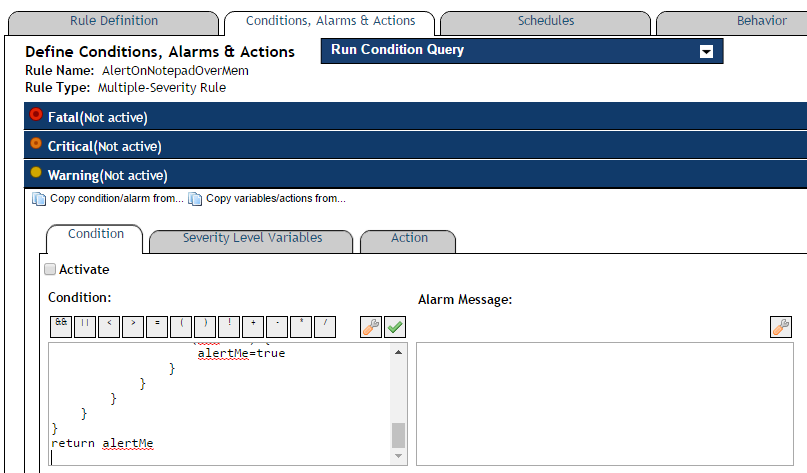
Set the Warning
def threshold=7150
def cnt = 0
def alertMe = false
scope.each{
// Once I find a process I need to create a dataService to process the instance items
def dataService = server.DataService
def instances = dataService.retrieveLatestValue(it,'instances');
// This goes through each one of the process instances
instances.each {
it.value.workingSetSize.each {
if(it > threshold) {
cnt++
if (cnt > 1) {
alertMe=true
}
}
}
}
}
return alertMe
Write a clear message
You can even tell them the PID of the process instance that are taking memory by scripting a message like this:
def overThresh1 = ""
scope.each{
def dataService = server.DataService
def instances = dataService.retrieveLatestValue(scope,'instances');
instances.each {
it.value.each {
if (it.workingSetSize > (7050)) {
overThresh1=it.pid + ", " + overThresh1;
}
}
}
}
return overThresh1
Summary
It took some trial and error but we got it done and the customer was very happy. Another one of those strange edge cases that come up time and time again in the Enterprise where you need to put your developer hat on. In this case we looked at memory but it would have also been just as easy to look at CPU at the process level if the case called for it. Happy Foglight coding!
