
Auditing an application of its users’ activities can be useful and at times a mandatory task in tightly-secured environments. Spotlight has many robust capabilities such as deleting or disabling connections to changing alarm threshold values or stopping and starting SQL sessions or Windows processes just to name a few. Spotlight users can have powerful control not only over Spotlight’s configuration settings but also on SQL and Windows monitored hosts as well.
Although such configuration updates are only authorized to be performed by Spotlight Diagnostic Server Administrators group members, they can cause various unexpected behaviors within and outside of Spotlight if they are not controlled properly. As an example, the user might witness Spotlight raising unusually high number of unexpected alarms which should have been acknowledged automatically. In other cases Spotlight no longer generates expected routine emails. In other instances, users notice a SQL Agent job running out of schedule or a Windows services has been paused. Consequently, auditing user activities in Spotlight can be an integral part of an administrator’s daily routine.
So how does it all work? Spotlight utilizes its Playback Database functionality that’s required with every installation of Spotlight to not only keep historical data of your monitoring matrix but also store historical user activity data. This data is then extracted and captured in a CSV report log that can facilitate user reporting needs.
In Spotlight versions 12.0 and newer to access the data, run the Audit and Configuration Changes Reports within the application. You can find Spotlight reports under the Reports tab of the left-hand side panel of the application.
In Spotlight versions previous to 12.0, follow the below steps to locate the Audit log CSV file.
To locate this file, on the Diagnostic Server host, locate the default Diagnostic Server installation folder which by default is: C:\Program Files\<Dell or Quest Software>\Diagnostic Server
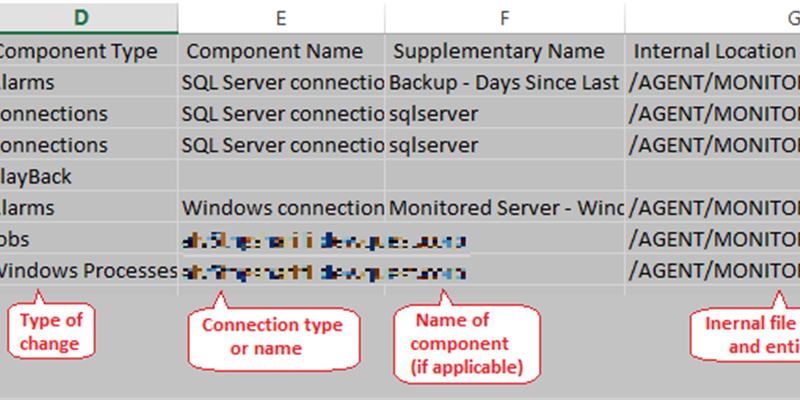
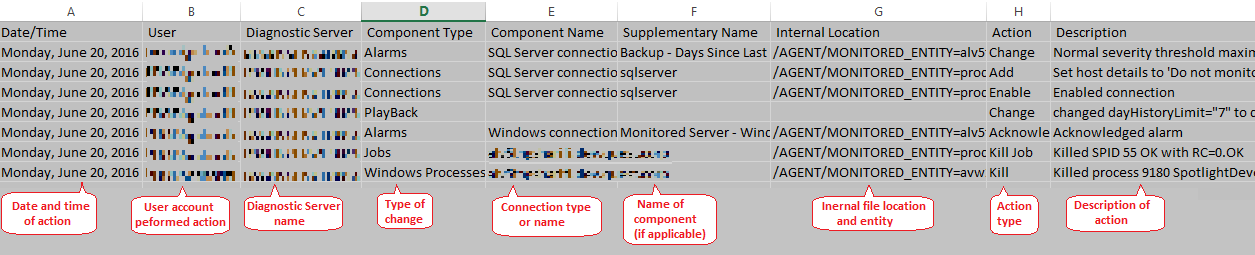
From there, change subdirectories to \Agent\log and locate UserActionLog.csv file. In general terms this file holds the following recorded user actions:
- The configuration type updates made by Spotlight users.
- The time the update was made.
- The configuration value before and after the update.
These are the user action categories Spotlight records:
- Changes to Configure | Spotlight settings
- Changes to the Spotlight License setting
- When an alarm is acknowledged, snoozed or ignored
- Activities on monitored SQL Server
- Activities on monitored Windows Server
Here’s a screen capture of a sample file and its contents:
See it in action! Download your free trial of Spotlight on SQL Server Enterprise.
Here’s the detail list of actions in each category:
Configure Ribbon Tab
|
Connections |
Manage the connections monitored by Spotlight. The log records all applied changes. |
|
Alarms |
Set the thresholds and severities that determine when an alarm is raised. The log records all changes as applied to a monitored connection or template. |
|
Alarm Actions |
Set actions for Spotlight to take when an alarm is raised. The log records all saved changes. |
|
Scheduling |
Spotlight collects data according to set schedules. The log records all changes to these schedules as applied to a monitored connection or template. |
|
Planned Outage |
Changes to Planned Outage are recorded in the log of user actions. |
|
SQL Analysis |
The SQL Analysis dialog is used to determine what data is collected and displayed in the SQL Analysis - Workload View and the SQL Server | SQL Activity Drilldown | SQL Analysis page. The log records all changes to the SQL Analysis dialog as applied to a monitored connection or template. |
|
SQL Server Response Time |
The log records changes to the SQL statement used to measure SQL Server response time as applied to a monitored connection or template. |
|
Custom Counters |
The log records changes to the configuration of custom counters as applied to a monitored connection or template. |
|
Error Log Entries |
The log records changes to the error log entries Spotlight is configured to scan the SQL Server error log for, as applied to a monitored connection or template. |
|
Monitored Files |
The log records changes to the list of files tracked for size by Spotlight as applied to a monitored connection or template. |
|
Spotlight |
Changes to the configuration of the Spotlight Client are not recorded in the log of user actions. The Spotlight Client is configured by changes to: Configure | Spotlight | Change Display Configure | Spotlight | Troubleshoot Spotlight |
|
Diagnostic Server |
The log does not record changes to the Spotlight Client connected to the Spotlight Diagnostic Server. The log does not record changes made to the Select a Diagnostic Server dialog.
The log does record changes to the configuration of the Diagnostic Server:
Configure the database maintenance schedule
|
|
Spotlight Cloud |
The log records changes to the configuration - upload data to the Spotlight Cloud. |
|
User Experience |
Changes to User Experience are not recorded in the log of user actions. |
|
Templates |
Changes to Configuration Templates (Save, Delete, Rename) are recorded in the log of user actions. |
Changes to the Spotlight License
|
Product Licenses |
Changes to the product license are recorded in the log of user actions. |
When an alarm is acknowledged, snoozed or ignored
|
Acknowledge |
The log records when an alarm is acknowledged. |
|
Snooze Alarm |
The log records when an alarm is snoozed. |
|
Ignore Alarm |
The log records when an alarm is ignored |
.
Activities on monitored SQL Server
|
SQL Activity |
The log records when a user kills a session from the Spotlight Client. That is command Sessions | Kill Session. |
|
Databases |
The log records when a user runs the Update Statistics command on selected indexes from the Spotlight Client. This command is run from the Indexes page of the Databases drilldown. |
|
Support Services |
The log records when a user starts a SQL agent job from the Spotlight Client. That is command SQL Agent Jobs | Start Job.
The log records when a user changes the running state (Start / Stop) of a service from the Spotlight Client. This change is actioned from the Service Status page of the Support services drilldown.
The log records when a user takes the following actions on Cluster Services from the Spotlight Client:
Take Offline - Makes a cluster resource or cluster group unavailable. Bring Online - Starts a cluster resource or group. Move Group - Moves a cluster group to another node of the cluster. |
|
Configuration |
The log records when a user changes a configuration parameter from the Spotlight Client. |
|
Error Log |
The log records when a user archives the current error log file and opens a new log file from the Spotlight Client. That is command Cycle Error log. |
Activities on monitored Windows Server
|
Processes |
Terminates a process from the Spotlight Client.
Changes the running state (start, stop, pause, resume) of a service or device from the Spotlight Client.
|
Click here to learn more about Spotlight features or join our community site.


