
Performance Analysis for SQL Server, and Performance Analysis for Oracle, have been long-standing tools in the our portfolio (The following article only applies to SQL Server and Oracle. Performance Investigator for DB2 has not yet been developed). When each product was initially released in early 2000, through much this millennium, Performance Analysis provided unmatched depth of data, as well as the broadest feature set in the industry when it came to analyzing and diagnosing issues related to query performance. Customers raved about Performance Analysis’s feature set, and how it helped them solve complex problems, however the product was not without its faults. Over the years, customer’s environments grew, primarily in the number of database instances each DBA was tasked with managing, but also in the criticality and complexity of their infrastructures. While Performance Analysis continued to provide tremendous value, it became clear that the products legacy architecture was not keeping up with customer demands, so we set out on a project to revolutionize how customers diagnose and analyze query performance problems. The requirement was to maintain the robust feature set that customers have come to expect from Performance Analysis, but build this new solution on a simpler and more scalable architecture, which provides a more modern, web-based user interface. The result of this project, was Performance Investigator (for SQL Server and Oracle). The following post, as well as two others to follow, will cover the differences between the Performance Analysis and Performance Investigator architectures, the new and enhanced features provided by Performance Investigator, as well as the upgrade process for moving from Performance Analysis to Performance Investigator.
Performance Analysis vs. Performance Investigator Architecture
As mentioned above, our primary goal in the transition from Performance Analysis to Performance Investigator was to make the Performance Investigator architecture far simpler, more scalable, and better integrated into a customers existing monitoring solution. The following changes to the Performance Investigator architecture have accomplished this:
- Agentless Data Collection: Performance Investigator now relies on an agentless data collection, which queries its data from objects and views that the database instances make available. Dynamic Management Views (SQL Server), and Oracle Performance Views (Oracle, with no need for any additional Oracle licensing, meaning all editions of Oracle are supported), provide Performance Investigator with the query performance data needed for analysis without the need to have a local agent installed directly on the database server. Performance Analysis leveraged an agent based collector (called Stealth Collect), which provided the depth of data needed, at an extremely granular collection frequency, however the administrative overhead of installing, configuring, upgrading, and maintaining those agents became prohibitive for many customers, especially those managing large environments. The agentless data collection that Performance Investigator is built upon, provides the same, and in some cases better, granularity of data, with a far simpler and more centralized approach to installing and upgrading the technology. The overhead of the agentless collection, remains very low, typically consuming around 1% of the overall systems resource utilization, with no impact to transactional throughput.
- Consolidated, Cross Platform Architecture: The Performance Analysis architecture consisted of four architectural components. As we’ve already discussed, the data collection was performed by a locally installed agent, which sent its data to a “Middleware” service, usually installed on a separate server, which then stored its data in a long term repository database, and was accessed via a locally installed desktop client. Also, if a customer was monitoring both SQL Server and Oracle, a separate installation (all four components) was required to monitor each platform. This means that to monitor one instance of SQL Server, and one instance of Oracle, 8 architectural components were required. In Performance Investigator, there are only three components, which can be shared amongst both SQL Server and Oracle. A Foglight Management Server (which includes an operational repository of either SQL Server, Oracle, MySQL, or PostgreSQL) handles the middle tier processing of data, and also provides the web-based user interface for the solution. A Foglight Agent Manager is responsible for collecting data from your SQL Server and/or Oracle instances, and an embedded (meaning that Foglight will install and manage it for you) Performance Investigator Repository, stores all of data, both short and long term. To make things even easier, all of these components can run on the same system (assuming properly sized hardware). Lastly, Performance Analysis required a desktop client that required direct access to the SQL Server being monitored (over a proprietary firewall port), as well as the Middleware and Repository systems. This commonly required firewall ports to be opened, and occasionally resulted in customers having to run the desktop client from a remote machine. The user interface for Performance Investigator is now delivered via the Foglight web console, meaning that any system with browser on it that can connect to the Foglight Management Server will be able to leverage the product. No longer does the interface need direct access to the systems being monitored.
- Dramatically Improved Scalability: The Performance Analysis architecture, most notably its Middleware service, had some fairly significant scalability limitations. On Windows installations (Linux/Unix installations had higher scalability), no more than 15 database instances could be supported by a single Middleware. Despite the fact that multiple Middleware installations could be installed on the same system, customers with extremely large deployments struggled with these limits, both from an installation and maintenance standpoint. As of Performance Investigator version 5.7.5.10, up to 800 database instances can be supported on a single installation, assuming adequately sized hardware, for which the requirements are documented in the products deployment guide. For customers with more than 800 database instances, a federated architecture is available that allows customers to run multiple installations, side by side, yet still view all monitored instances in a single console. This improved scalablity should greatly assist all customers in managing deployments of all sizes.
- Better Integrated: The last goal in re-imagining the Performance Analysis Architecture was to provide an workflow that was much better integrated into the rest of a customer’s database monitoring experience. Having to manage Performance Analysis, as a completely separate architecture and user interface, provided a challenge to our customers both having to install, configure, and maintain two separate architectures, as well as juggle two separate user interfaces. Performance Investigator now seamlessly integrates into our Foglight for Databases solution (similar integration with Spotlight Enterprise planned in the very near future), providing both a single product to manage, and a single user interface to interact with.
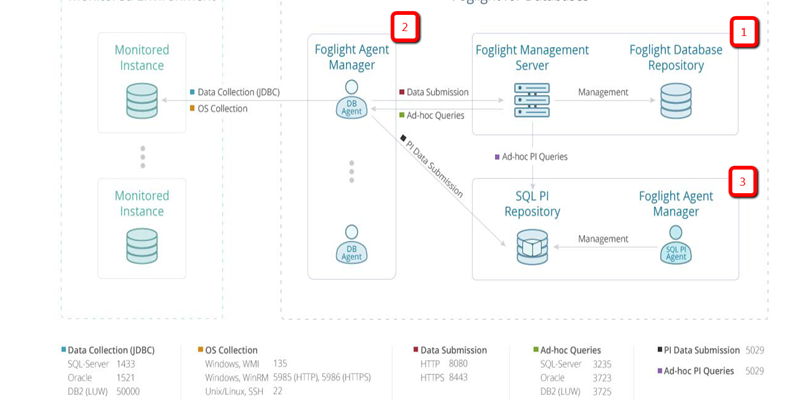
Performance Investigator Architecture:
With the above goals in mind, I now present to you the architecture of Performance Investigator. A diagram is also presented below.
Performance Investigator relies on three primary components. Two components are specific to the Foglight architecture, and for those customers running Foglight, are already in place. The third component is specific to Performance Investigator, however fully installed, configured and managed by the Foglight platform.
- The Foglight Management Server (1) acts as the primary user interface for both Foglight and Performance Investigator. The Performance Investigator drilldowns and workflows are available as a part of the typical Foglight workflow. This Foglight Management Server also handles the user authentication to Performance Investigator, scheduling and delivery of Performance Investigator reports, alerting around Performance related issues, and more.
- The Foglight Agent Manager (2) acts as a data collection service. This is where the agentless data collection is initiated from, thereby connecting to each SQL Servers and/or Oracle databases that you wish to monitor. A customer can have as many Foglight Agent Managers as needed in order to support the number of instances in an environment, as well monitor complex networks involving firewalls, non-trusted domains, multiple data centers, and so on. For an example around a complex deployment including non-trusted Windows domains, see the following post.
- The Performance Investigator (PI) Repository (3), is the centralized data store, which processes and stores all PI collected data both short and long term. This is a proprietary and embedded database, meaning that the customer need only provide a server to install it on, and Performance Investigator will take care of the rest. All installation, configuration, and ongoing maintenance will l be handled internally by the product.
For more information pertaining to the Performance Investigator Architecture, as well as documentation around the hardware sizing, and prerequisites needed to perform an installation, please consult the Performance Investigator Deployment Guide, which can be found on the product download page for the appropriate solution:
