Wondering where to find the Webmonitor metrics for use on a custom dashboard?
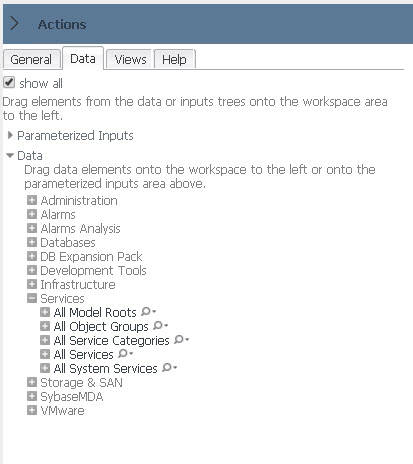
You will find them on the Data tab, but there is no pre-defined category for them. Start by checking the "show all" box, and then expand Services and All Model Roots. This is where most Foglight data can be found regardless of category.
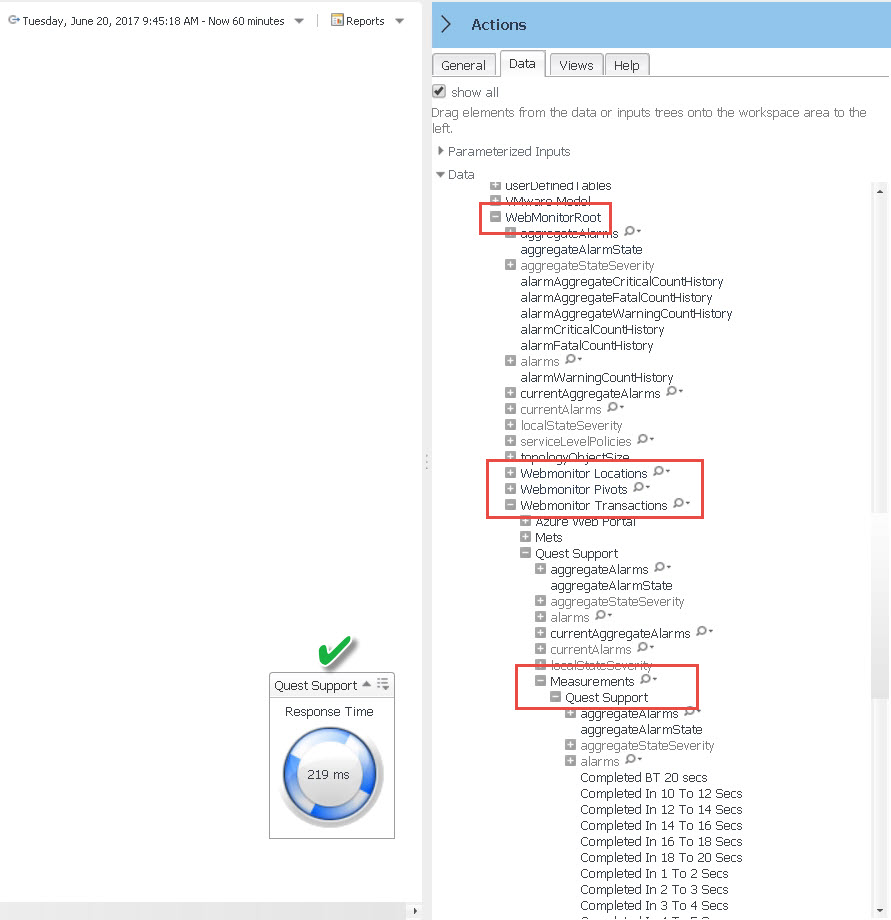
Scroll most of the way down, and you will see WebMonitorRoot. Expanding that gives us 3 options - Locations, Pivots and Transactions. Expanding those will show the relevant nodes, and under each, there is a Measurement node with all of the metrics. You can then drag those to your dashboard and customize appropriately.