

I often get asked about monitoring SQL workload that is consuming a database instance’s resources. The first question that comes to my mind is, “What is the symptom you are trying to resolve?” Are you looking to understand the root cause of compute resource consumption such as CPU, I/O, memory and timing? Or are you looking to get to the bottom of a specific set of wait events that have been present in the abnormally large database wait times? Monitoring workload at the database level is just like two sides of the same coin. What I suggest is that we take a look at how Spotlight® on SQL Server Enterprise can be used to help you identify the workload that is consuming either compute resources or event waits.
Heads: Identifying workload that consumes compute resources
On the Spotlight home screen for the instance I was connected to, I used the playback tools to focus on a time period where the instance was experiencing CPU utilization that was at a warning level or higher. This allowed me to review the processor utilization as well as get a cursory look at other circumstantial activity on the instance.
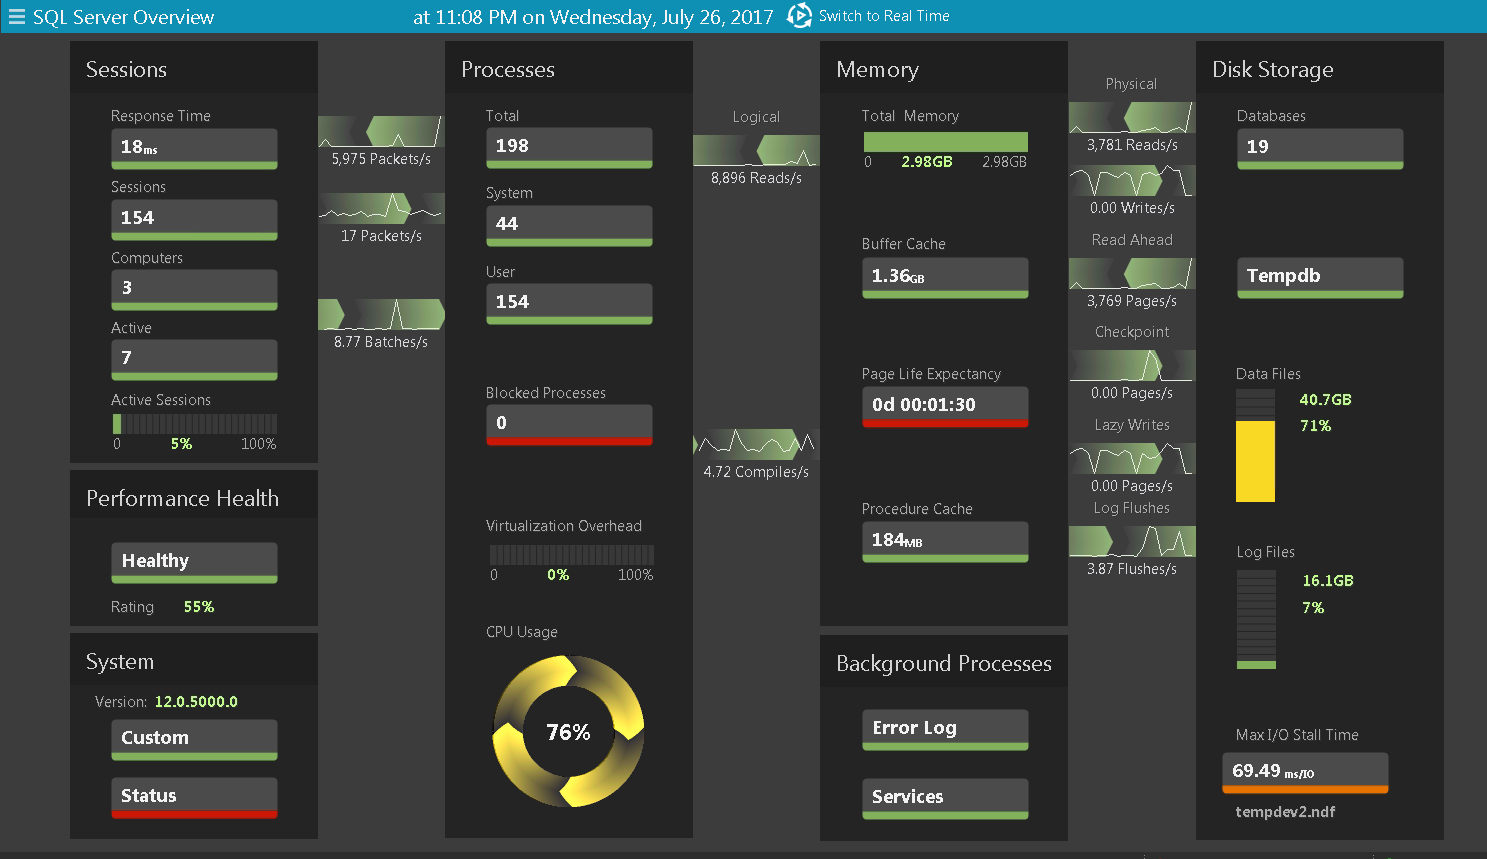
Fig 1. Spotlight Home Screen after Playback Selection
Next, I used the Workload Analysis feature available on the SQL Server Drilldowns section of the Spotlight ribbon bar. This feature allowed me to summarize data based on different stretches of time, but in this case, it was context sensitive to the time range in my playback.
The Resource list box is also available. It allows you to choose which compute resource you are interested in researching, such as CPU, duration and I/O categories.
Since CPU was my main concern, I simply selected CPU. Then, I used the navigation tree to expose the databases that were being accessed during this resource consumption, and viewed the SQL statements that were running at that time.
In a few easy steps, I prioritized and identified workload that was contributing in a large part to the CPU resource consumption I was seeing historically.
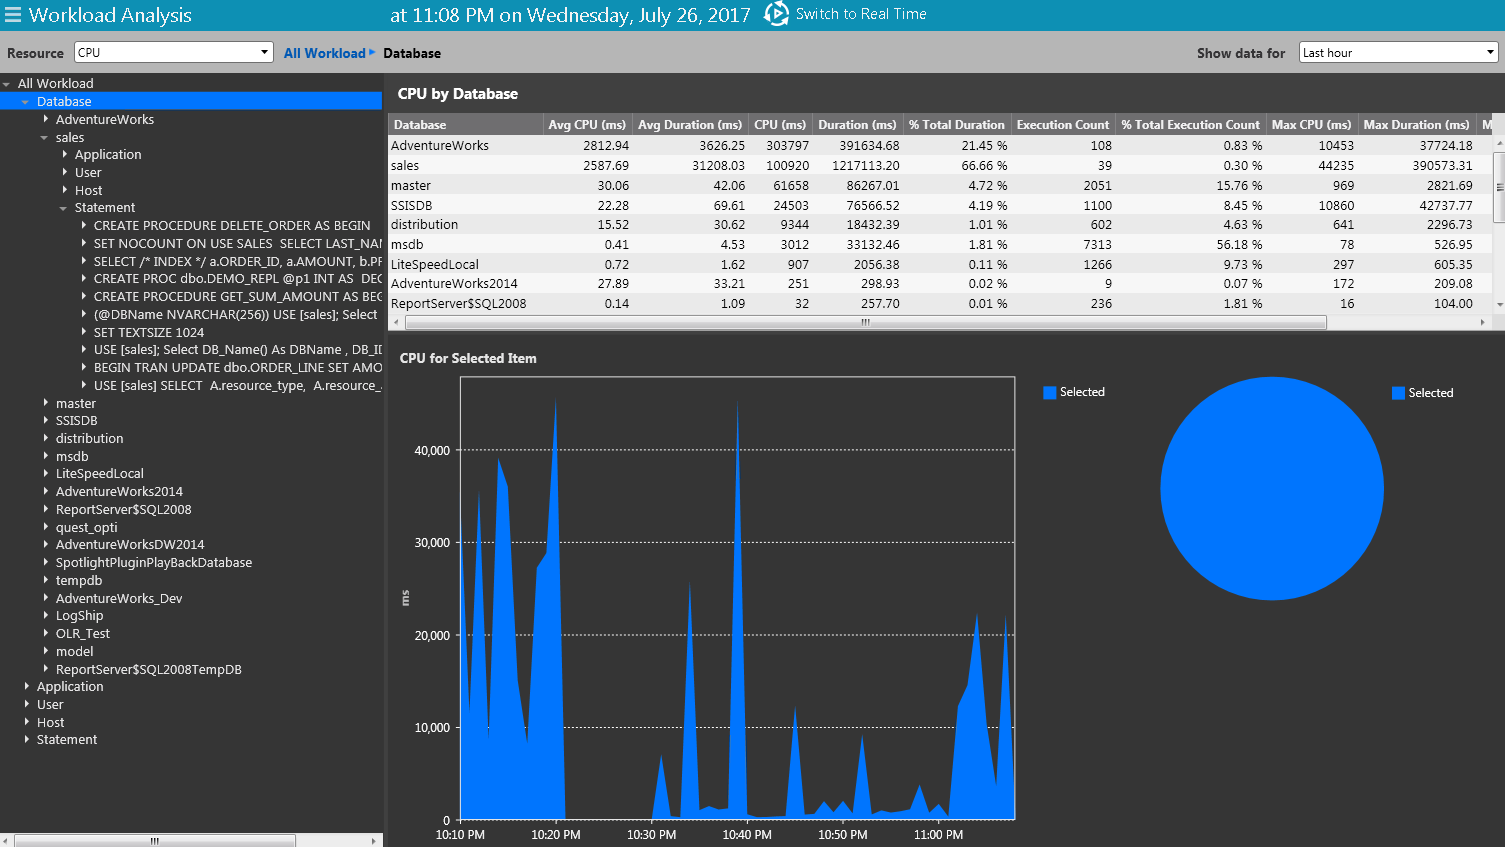
Fig 2: Workload Analysis
Tails: Identifying workload involved in specific wait event types
The above use case is great when you’re trying to research overall compute resource consumption, but managing wait events does involve a little more nous. There are hundreds of event wait types catalogued in the database, and each has its own specific treatment plan. While I won’t get into the actual tuning of specific event waits, I do feel it’s important to show how you can fulfill a fundamental starting point in that tuning task to identify the contributing workload.
Heading back up to the SQL Server Drilldowns section on the ribbon bar, I clicked on Wait Statistics to see what type of wait events were prominent during a period of time. This helped me focus and prioritize which specific event waits require tuning and others that are just ordinary that shouldn’t require a knee-jerk reaction.
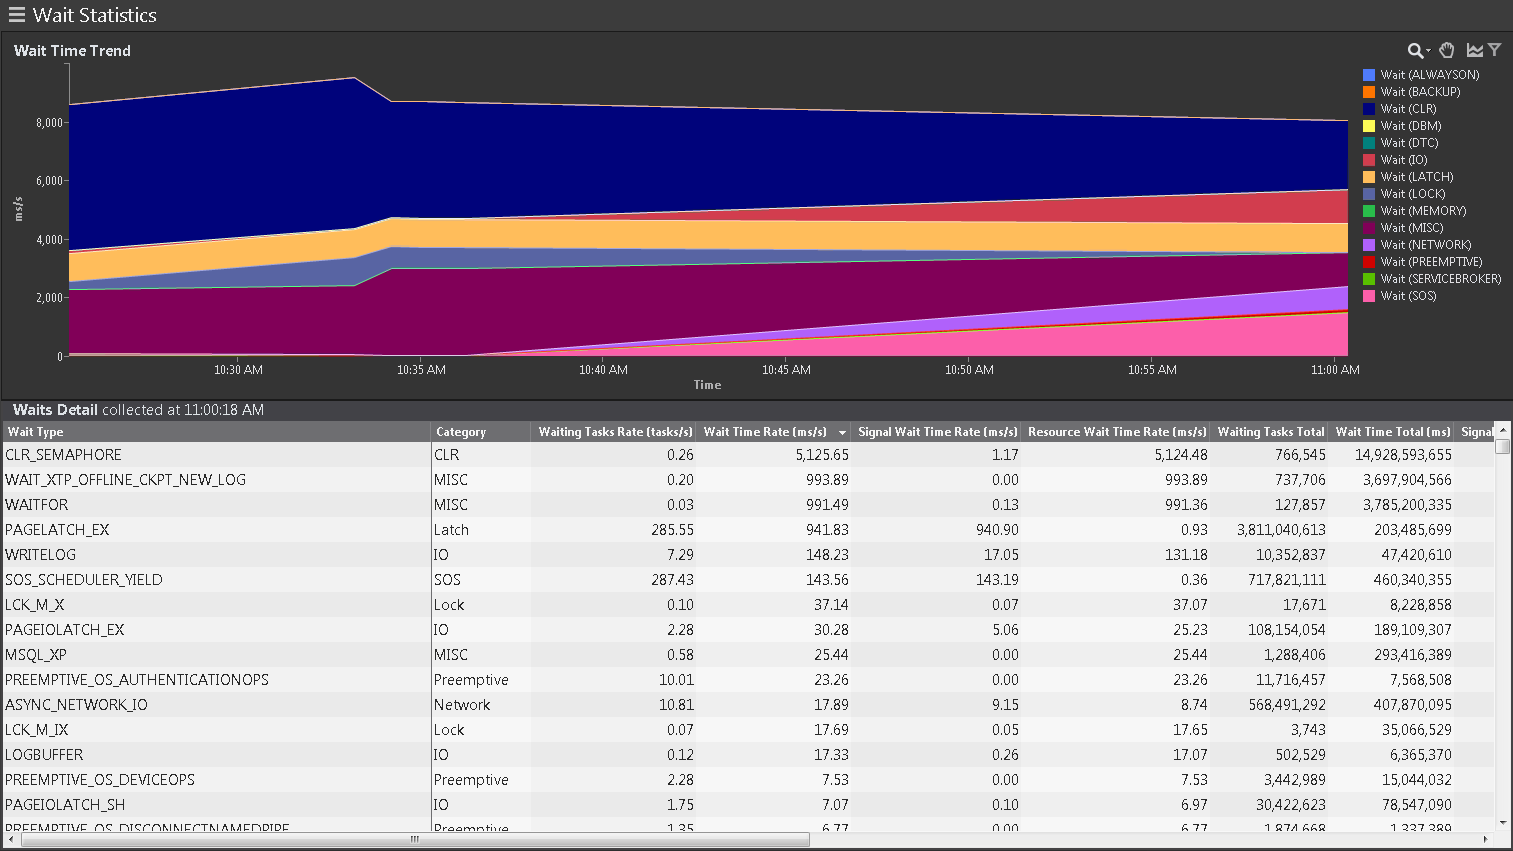
Fig 3: Ranking Wait Events in Spotlight
Now with a few event waits in mind, I headed back to the SQL Server Drilldowns section and clicked on Wait Events. Our development team has done us all a favor and categorized the hundreds of specific event wait names into broader, easier-to-understand categories, such as I/O, lock, backup, memory and network.
For this use case, I simply expanded the Wait Type dimension and then expanded on the wait event names I was interested in researching to see the databases that were consumed and SQL statements that were executed. These details were helpful, as they showed what was causing the wait events in the first place. Of course, the tuning task still remains ahead.
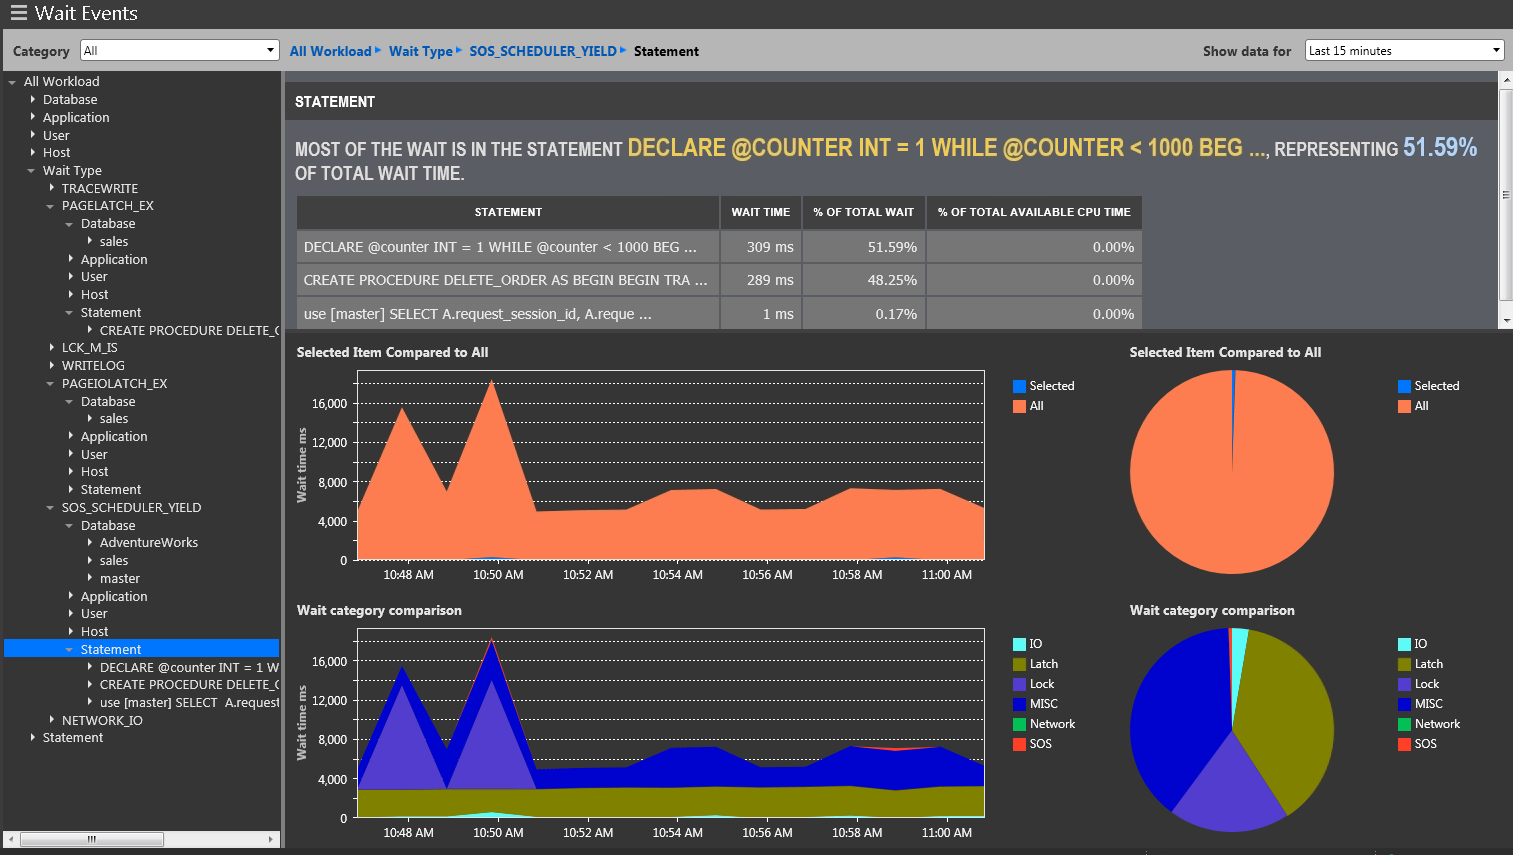
Fig 4: Analyzing workload involved in specific Wait Events
Either way, Spotlight on SQL Server Enterprise has you covered
Spotlight on SQL Server Enterprise is a great solution for taking SQL workload monitoring to the next level. The use case above took just a few clicks, and the data is there — saving me valuable time in researching the problem, and allowing me to spend more time on the actual tuning task.
For more information on how to use Spotlight on SQL Server Enterprise as well as managing your SQL Server environment, visit SQL Server solutions.

