
Foglight has many out of the box rules to evaluate performance and availability conditions for your databases, virtual and physical infrastructure, web pages, network devices, etc. Once it has been running for some time, it's a good idea to evaluate which rules are enabled, and which ones are triggering the most alarms.
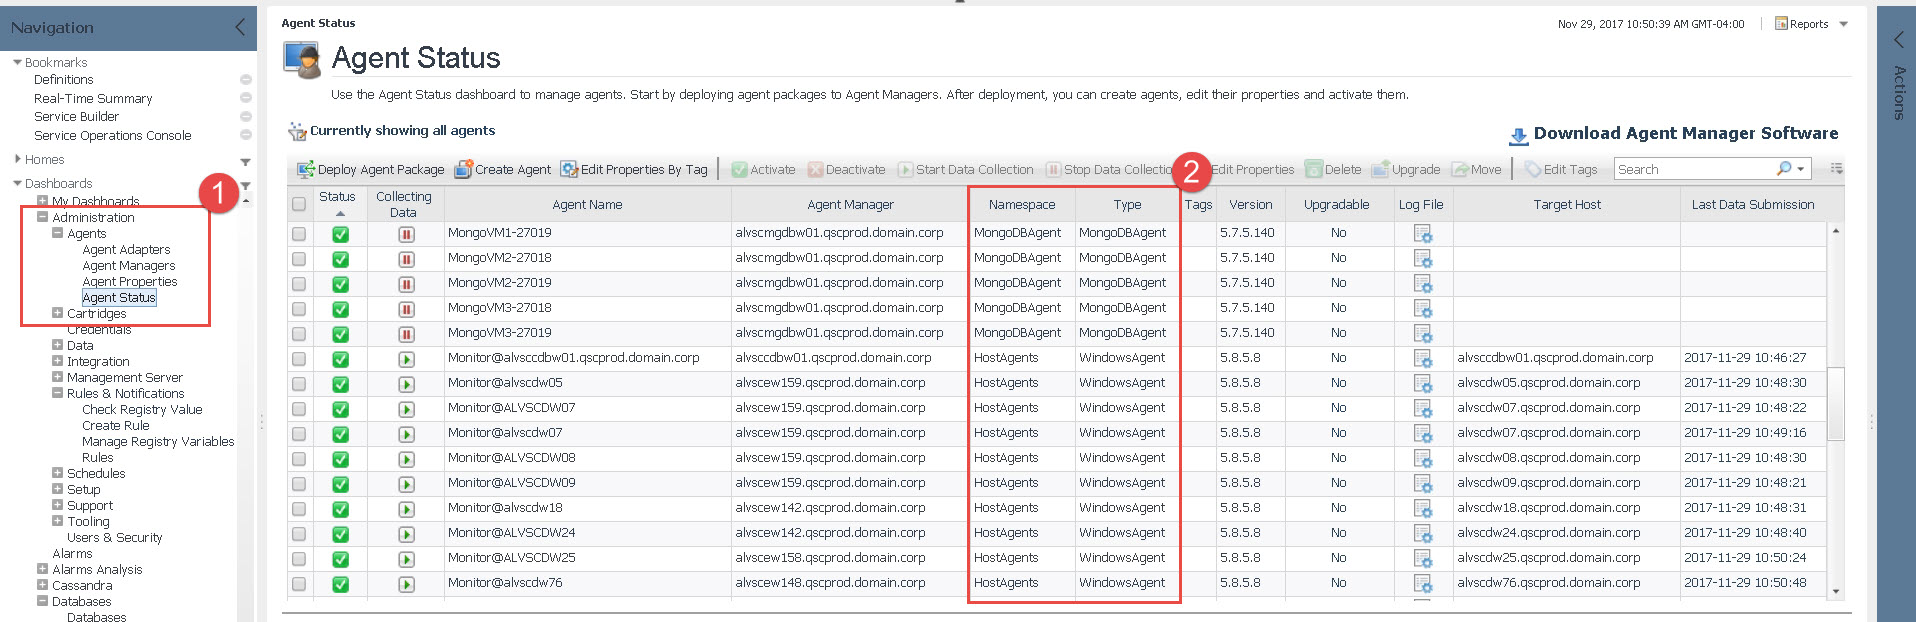
The first step to see what rules apply to a "device" is to check the Agent Status page to see what type of device it is. The namespace and type columns will help. Most agents are fairly easy to figure out.
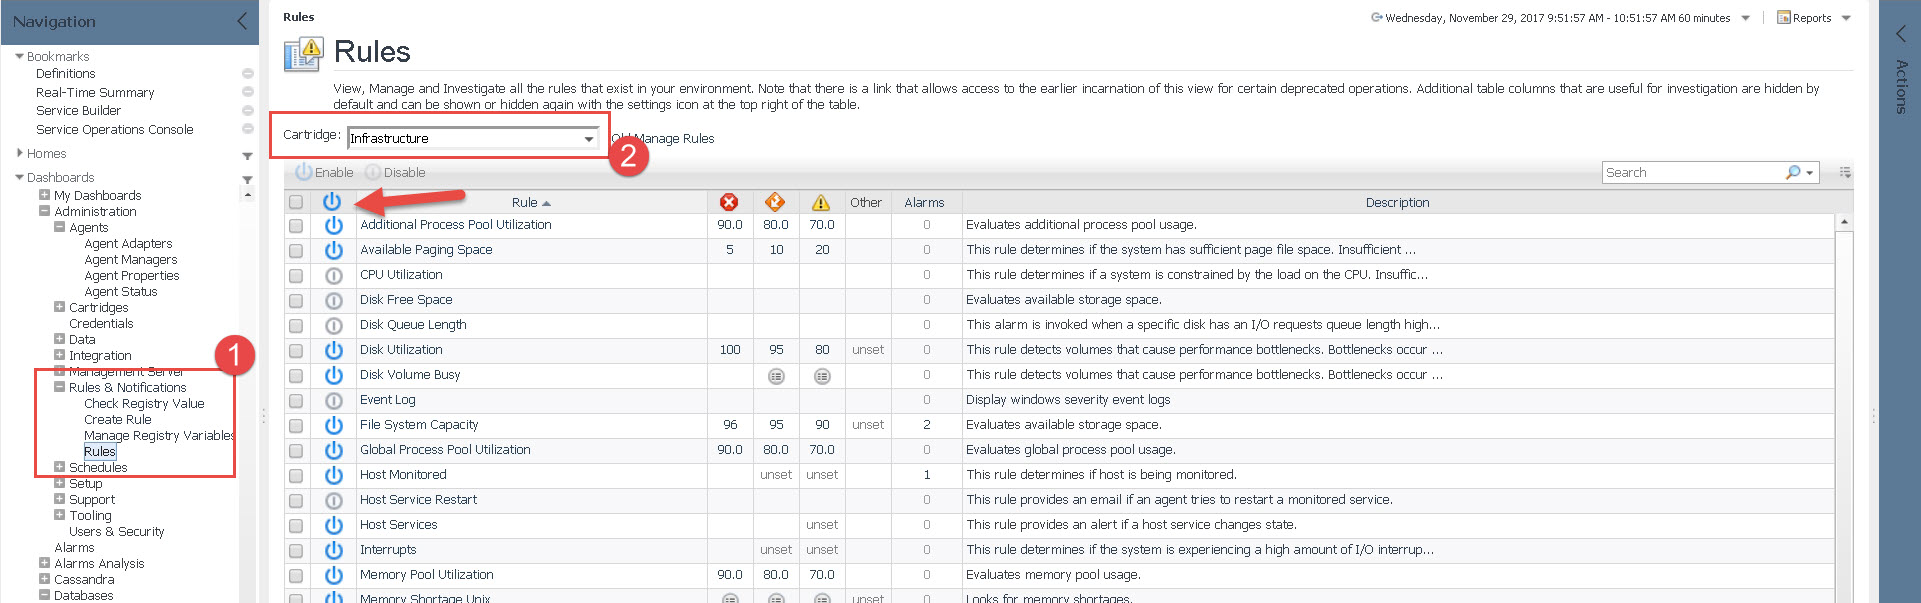
Next, go to the Rules dashboard, and pick the cartridge type from the pulldown. Normally it's easy to see a 1:1 relationship from the prior dashboard, but sometimes it's not. HostAgents generally fall under the Infrastructure cartridge. From there, we can see what rules are enabled for that type.
A rule fires when a condition is met. The result is an alarm (or some will say an alert). There is a 1:n relation between a rule and alarms. For example, if we have 100 hosts being monitored, and they all have a condition where the "cpu utilization" rule evaluates to true, then we would have 100 cpu utilization alarms.
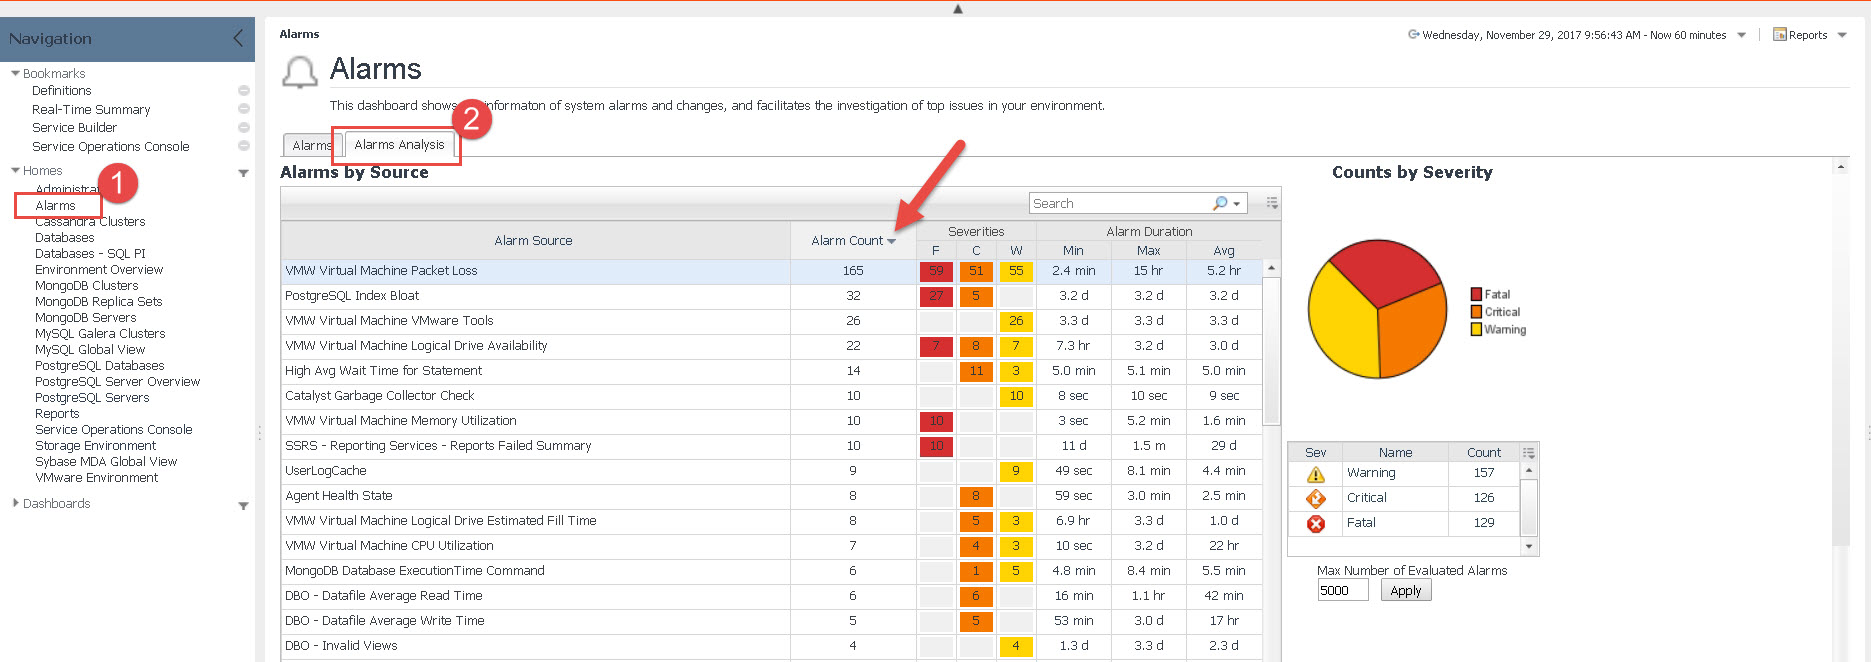
The quick way to see "what has fired" is to use the Alarms Analysis dashboard. Navigate to the Alarms dashboard, then Alarms Analysis tab. Pick a time range and then sort by Alarm Count.
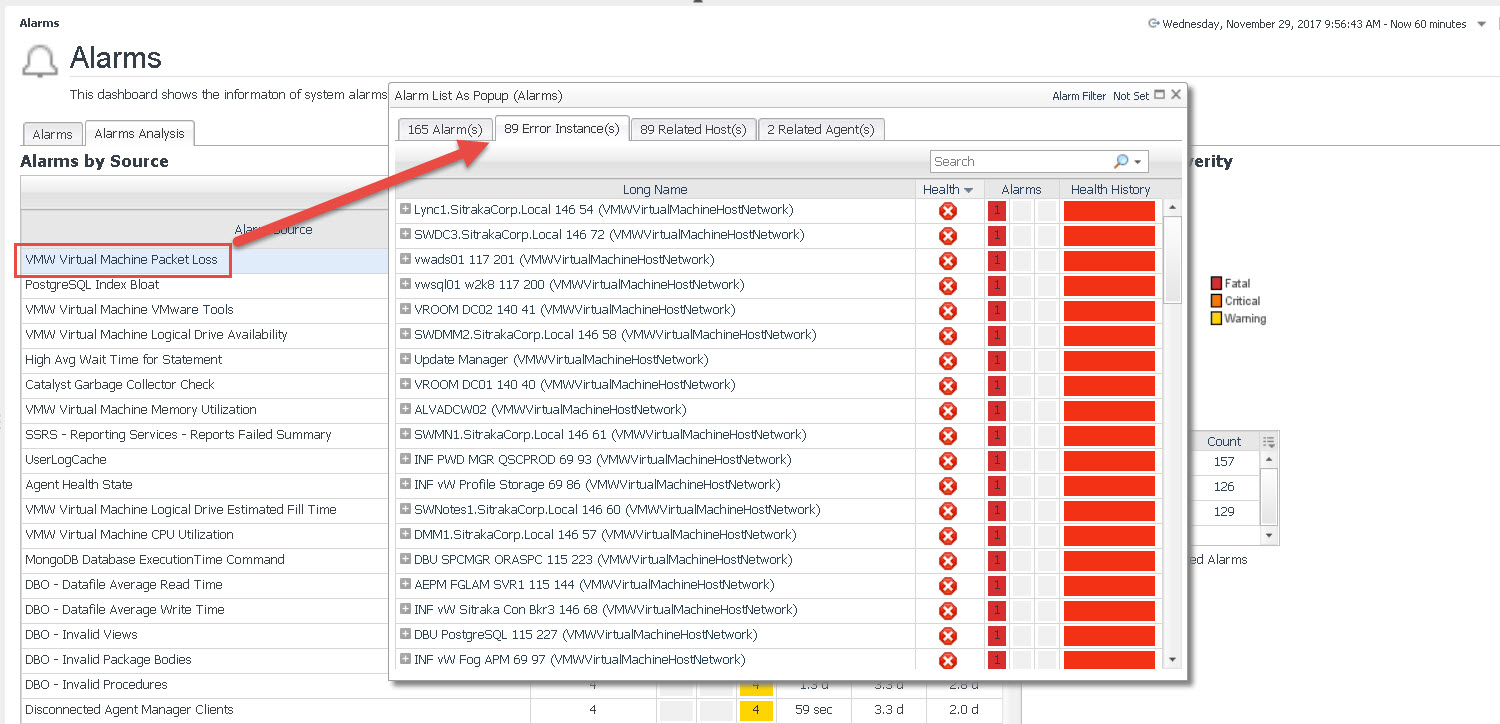
Clicking on an alarm in the Alarm Source column pops up additional detail. Select the "Error Instances" tab to see the objects (ie. devices, hosts, etc.) that the rule fired an alarm against.
Click here for additional information on Foglight!
