Hello. I'm Todd Tobias, one of the Systems Engineers here. And today, I'm going to show you a module that's available in Active Administrator called Active Directory Health. This module is designed to help you understand and analyze your domain controllers and your domain. This will help you understand the health and analyze quickly, where a problem may arise.
There are few components within this product. You're looking at the dashboard, where this will give you a summary information of how healthy your domain controllers are. How consistent RID master is, for example. Also, what kind of alerts there might be. There are a few categories for those.
And if you've got multiple domains you want to monitor, you'll see them on the bottom section of this dashboard.
There is a module called Analyzer, Alerts, Agents, and Troubleshooter. This portion of the product does require agents. And these agents can be deployed a couple of different ways. Either to your domain controllers or through a pulling method. Today, we're just going to talk about the product.
So once you open up the Analyzer section, you could then see a summary of detail. Such as the domain controllers you have in your domain. How many global catalog servers there are. How many PDC owners. How many RID masters, etc. As well as, the health.
Along the top, you see a summary. Replication latency, here's where I could see if I've gotten to see any issues with my communication between my domain controllers. You can also see any latencies between global catalog servers. As well as any general alerts that might be occurring in your environment. And you could see all the different alerts here.
These are really informational because we set baselines based on counters. And so you'll see that in a bit.
Here's where you can see the information such as, for example, a domain controller FSMO role placement. We give you best practices information so that you can be a better administrator over your environment.
If I drill into any one of my domain controllers, we give you more detail. Such as a trend analysis to show you some average trends over time based on different counters that we have, page fault, for example.
And if I go along the top here, you can see some additional information. Here that you can see your OS version. How long the system has been running. Whether it's a DC or a not, global catalog, et cetera.
A really great facet to the solution is understanding what services are running. So here, you can see, particularly over a period of time, what services are running. Whether they have an up or down. If a service has been down during a period of time, it would, of course, be red.
And you can see here across the board, also some server information. Gives you detail about the operating system. What version's installed. The last time it was booted. Particulars such as physical memory, virtual memory, even down to the disk space. As well as the network adapters that are on the machine.
Looking along the top, Active Directory information. So this is really important information to understand, even how many available RIDs you have. If the vines are shared and healthy. What does my Active Directory database look like? How large is it growing? What's in my SIS file look like? What's the average time of response of my Active Directory environment?
Are there some peaks? This will help you understand that you may have some peaks during certain times of the day. Of course, you may see when users log in for the first time when they come back from lunch. This will give you a great understanding of the performance of the response times.
And, again, continuing over the top, Current Alerts. So here, I can see my alerts and understand what particulars are going on. Here, you can see I've got a group policy that's inconsistent. This could potentially cause a problem if my group policies are inconsistent.
Here you can see how long it's been going on for. And you can see the detail about that to take action, if necessary.
Also continuing on the top, I've got my applications that are installed on that domain controller. Any updates that there might be on the machine. Last time it was installed.
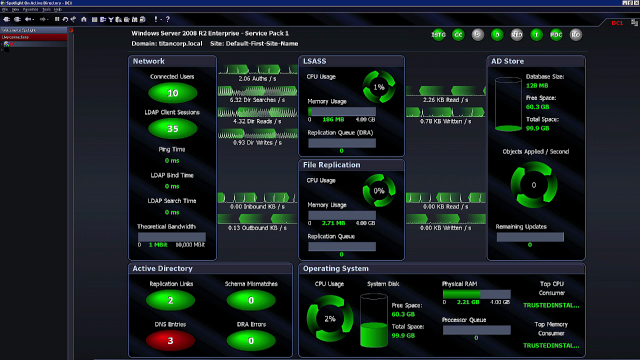
And, of course, there's another module on top of this called Diagnose. So if I hit the Diagnose, this will open up a window so that I can see my particular servers and get a greater granularity in real time as to what's happening on these servers.
Here, this is a spotlight component that you can see your network activity. How many connected users you have. Your LSASS processors. And kind of what's happening in your environment.
What's nice about this, too, is you can switch between domains controllers to see a better story as to what's happening. Each one of these components have the ability to have some drill down. So you could drill into different areas.
For example, if I look at my DNS entries. You can notice that there are some issues in here. There are alarms that are being raised. You could set different thresholds for your alarms.
If I look at my DNS drill down, then you can sort of see what happened here. Here you notice, I've got a few different unregistered records which is causing my problem. If I take care of that, the problem would go away. But any one of these, you can always right click and go to the metrics and see the different metrics as well as the thresholds.
So here's where you could set a different threshold for your items, if you wanted to have informational low, medium, high. You could set the color codes however you like.
Going back to the product. You can also set alerts so in order to be notified when an
 08:34
08:34