Hi. My name is David Orlandi, and I'm the subject matter expert for Postgres here at Quest Software. In this short video, I will focus on how Foglight can be used to tackle common performance challenges faced when monitoring Postgres. While Postgres has some similarities with traditional databases, the way that availability, performance, and capacity are managed is unique. Companies that do not have an efficient way of managing Postgres often struggle to realize the benefits that the platform can provide them.
What if you could rapidly detect, diagnose, and resolve performance issues across your physical, virtual, and cloud-based Postgres database servers? Let's take a closer look at a few important use cases where Foglight can provide value to monitoring performance in Postgres.
Use case 1, monitoring and managing locks in Postgres. One of the most valuable capabilities of Postgres is its support for concurrent ACID transactions. ACID is an acronym for Atomicity, Consistency, Isolation, and Durability. These database transaction properties help verify data validity. It is important to understand that locking could be a common occurrence in active Postgres databases. This is because Postgres uses these levels of locking as one of the ways to safely implement these concurrent ACID transactions.
Managing peak performance includes being aware of queries that might be taking too long to run. In some cases, these commands might be waiting for a lock. Foglight can help you identify and resolve these situations.
This is Foglight's database home page. Across the top, there are a number of database tiles representing the various DBMS types that Foglight supports for monitoring. Clicking on the Postgres tile allows for isolating just those Postgres instances.
Now, Foglight for Postgres provides several out-of-the-box visual alarms. These are preconfigured with default thresholds, but they are user configurable. To access and manage the alarms, simply check the box next to the instance or instances you want to manage. If you have the appropriate Foglight privileges, this Configure Alarms button will be enabled. Select it.
One of the Postgres alarms available in Foglight is called Potential Deadlock Issue here. Selecting it on the left side brings up its properties here in the center area. This blue link is where it can be enabled or disabled. Click the Enhance Alarm button to view or modify the severity levels and the associated messages.
Now, this alarm fires if there are any ungranted locks, referred to as locks waiting, older than the deadlock timeout setting. Foglight is pulling this information from the Postgres view, pg_locks.
Clicking on the breadcrumb trail in the top left corner will allow me to go back to the database home page. And simply click on the instance name to access the Overview page. From the Overview page, navigate to lock details by either selecting the Locks Waiting spinner or the Locks page option at the top.
If there are locks waiting, you'll see something like that. The data displayed includes the process ID, the user, the query that performed it, the query start time, and if the lock has been granted or not. If it is deadlocked, one or more have not been granted.
To resolve the issue, note the process ID, and select the Connections page option up at the top. Find the corresponding process ID. And on the far right of the Connections page, select the Admin icon. Now note, this requires that the user is configured with the Postgres administrator privilege. And from here, you can highlight the query and cancel it, or terminate the connection.
Use case 2, optimizing query performance in Postgres. One of the primary tasks of any DBA is to find and optimize poorly performing queries. This is not a trivial job, as oftentimes there's too much data to sort through and pinpoint problems. Foglight provides alerts for Postgres queries that have suspect behavior.
As seen in the previous use case, navigating to the alarms interface is done like this. Check the box next to the instance, and choose the Configure Alarms button. And for the use case of managing and optimizing query performance, two particular Foglight alarms can offer quick insight into queries that might need a closer look.
Those are High Average Response Time for a statement. This alarm fires when the average wait time for a statement significantly exceeds that of its historical average, as well as Postgres Buffer Hit Low Percentage table. This alarm triggers when the buffer hit percentage for a table is low.
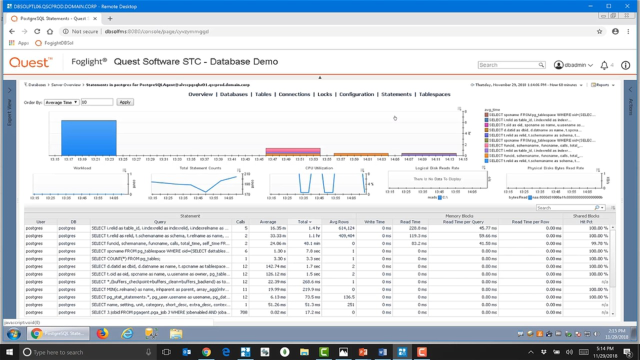
Now, from here, you'll go back to the Foglight database home screen by clicking on the breadcrumb trail in the top left. Click on the instance name to go to the Overview page. Once at the Overview page, click on the Statements link at the top to go to the Statements page.
Now, you'll want to find queries taking a longer amount of time to run and/or find those statements with low hit percentages, which is typically a result of long-running statements. Postgres tracks patterns of data access and keeps frequently accessed data in cache. It's best to keep a cache hit rate of about 99%. Consider increasing the cache available with a ratio significantly lower.
Now you'll want to select the query to go to the Statement Details page. At the bottom of the page, there's an option to request an explain plan to better understand the query steps and how long each step is taking for tuning purposes. Now, understand that the explain and the stat reset requires the Postgres administrator privilege.
Now additionally, you can check for indexes on the associated table, the Other Tables page. We'll use that breadcrumb trail again. Click on the Tables link for the Tables page.
Now, if and when changes are made to the table structure or query and you are ready to test performance, you can reset statement tracking statistics and display new performance data. Select the Admin button over to the right-hand side here. And select Stat Reset, and Perform Operation.
Use case 3, monitoring disk space usage in Postgres. Many things can happen if the database runs out of disk space. None of them are good. DBAs understand that it is essential to monitor database disk space so that critical business processes are uninterrupted. Foglight provides peace of mind by monitoring that space and alerting on the threshold well in advance of potential space issues.
Foglight for Postgres offers an alarm called Database Running Out of Disk Space. If the average calculated tablespace growth rate is going to use up the existing space on the hard drive within 15, 30, or 60 days, Foglight will fire the alarm. Keep in mind, this requires host monitoring via the Foglight infrastructure cartridge to be able to calculate disk space available.
Foglight provides tablespace information. Now note, tablespace information is not available for Database as a Service cloud environments, since the information is not managed by the user. Rather, it is managed by the service.
The tablespace data can be found in the lower right corner of the overview page. Here you can see the tablespace OID, name, owner, and total tablespace size. You can select the tablespace name or select the Tablespace link up at the top to drill down into the Tablespace page.
Additional information here includes the disk space distribution and the tablespace sizes over time. To further diagnose space issues, first determine the databases and tables using the tablespaces. Then make note of those databases' and tables' growth rate over time to help narrow down and determine which may be responsible for that increased tablespace growth. Tablespaces can and often host multiple databases and tables.
To do this, navigate to the Databases or Tables pages via the links at the top. This example is for tables. But navigation is the same for databases.
Another possibility for unexpected growth is that the system has not been vacuumed in some time. Look for large tables. Then see if there's a high number of dead tuples via the Live/Dead Tuples graph. In Postgres, tuples are logical representations of rows. Rows or tuples are not actually removed when they are deleted. Rather, they are simply marked for deletion. These are considered dead tuples.
A vacuum is an administrative process by which these dead tuples are cleared out to remove the dead space from the files. Foglight allows users to both view the current Postgres configuration of auto vacuum via the Overview page as well as initiate a manual vacuum. To perform a vacuum, select the Admin icon to the far right side of the Tables page, or the Databases page, and select Vacuum.
If an auto analyze has not been done and the structure has changed, consider choosing Vacuum and Analyze. Additionally, you can look to see if the system was recently auto vacuumed in the lower right. Again, note the user must have the Postgres administrator privilege to perform these tasks.
These use cases are part of the comprehensive performance monitoring, alerting, diagnostics, and analytics found in Foglight for Cross-Platform Databases. Implementing Foglight for Cross-Platform Databases will make your job easier and help to ensure the health and performance of your entire database environment.
Ready to learn more? Take a look at the information on this slide. These links allow you to access the Quest landing pages for Foglight for Cross-Platform Databases, Foglight for Postgres, and the Quest Community. And if you'd like to try out Foglight for yourself, you'll find a link to a fully functional 30-day trial.
 12:45
12:45