Hi, this is Debbie Peabody. And in this video, I want to go over one click to charting.
A lot of analysts spend the majority of their time developing the queries and getting the data that they need for the reports that they give to their end users. Most of these end up in Excel reports, but sometimes, the data should be given in a visual mode. And the easiest way is to do that in charts.
Here I have a query that I'm just going to run real quick. Basically, I'm getting the number of orders per region on a particular date range.
We've always had this tool set up here called the one click bar. These are also available from a right click menu under quick export.
It has a variety of one click exports to Excel, CSV, HTML. You can also send it to an Excel instance. In this case, you may want to add some formatting and pretty up the report or you can send it as a pivot table, or you can also send it to an Excel instance as a LINQ query.
New to TDA 3.0, we've added a one click instance to Excel charting. Here, we just simply open up Excel and we take the data that you have put in your grid, and we send it into a quick default graph.
Once you're in Excel, you can click on the design tab, change coloring, add labels, do whatever you would like. But the basic thing is is that one click into a chart so you can easily get that data in a visual mode.
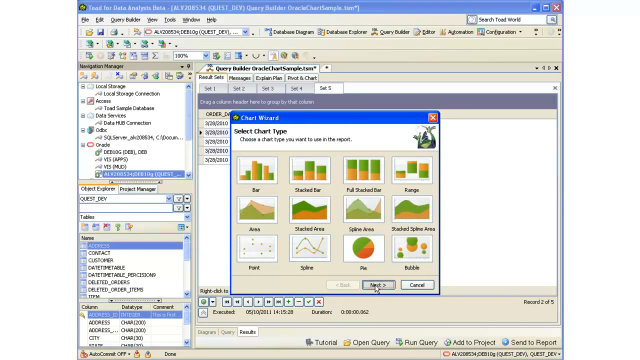
Now Toad for data analysis has always had a chart wizard, which is quite full features. Has quite a bit that you can do with the charting, but it's usually more than what you need. So we've also shortened up this chart design in this area. So you can send your dataset to the chart designer here.
Now what you'll get is a choice of graphs of whatever you like to use, and then you're simply asked what you want to have for the x and y-coordinate. And I'll just put in what I want here, and you get a quick preview here. And then it goes into a Toad data report.
Now this is basically a one page report, which takes up the real estate with a graph. Here you can add your own labels, change the icon, whatever you'd like.
If you'd like to go into the chart wizard, you can click from it up here, and you can go in and change all aspects of it. And there's quite a bit of choices, like I said before, of what you can do.
So that's one click charting in TDA 3.0. It should make your life a little bit easier. We also have added quite a bit more in data visualization, but I'll be covering that in another video.
 03:14
03:14