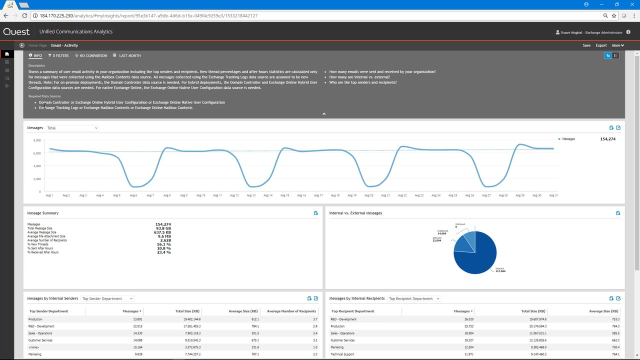
Overview and configuration of insights in Unified Communications Analytics
 03:48
03:48
Related videos
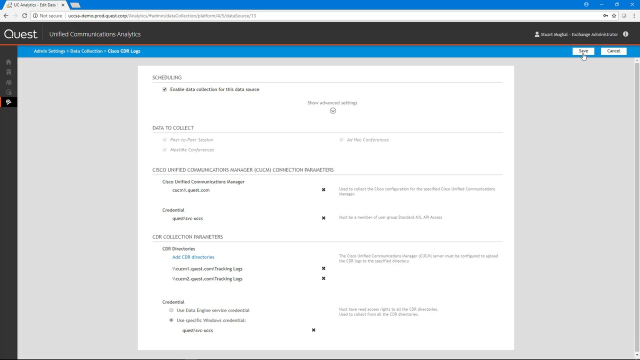
Configuring Cisco data sources in Unified Communications Analytics
Learn about configuring Cisco data sources in Unified Communications Analytics.
Duration: 02:09
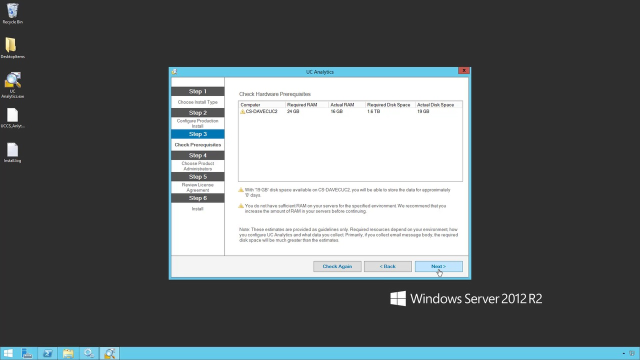
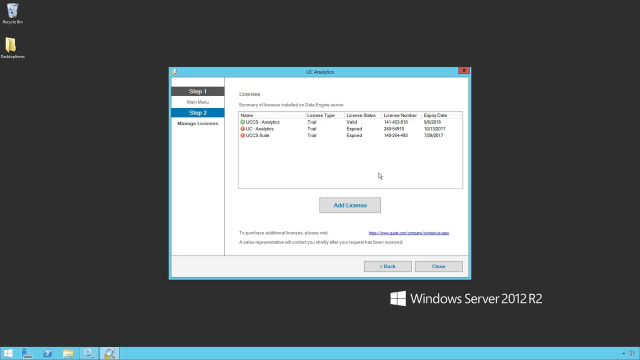
Basic installation of Unified Communications Analytics
See the basic installation process of Unified Communications Analytics.
Duration: 02:37
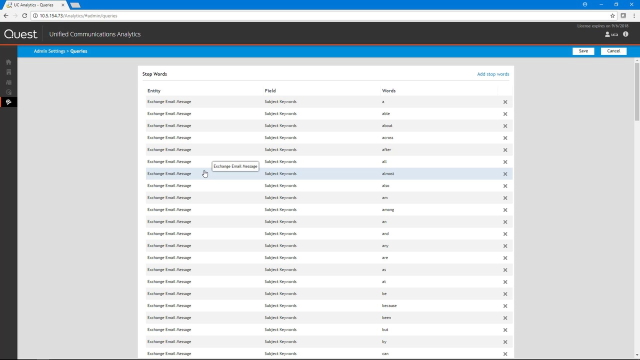
Admin settings overview in Unified Communications Analytics
See an administrator settings overview in Unified Communications Analytics.
Duration: 02:18
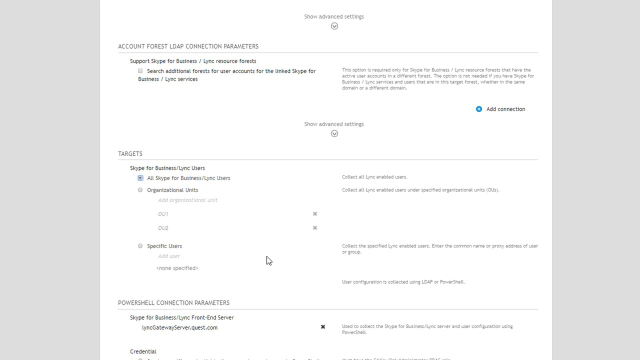
How to configure Skype data sources in Unified Communications Analytics
Learn how to configure Skype data sources in Unified Communications Analytics.
Duration: 02:58
Deployment Manager overview in Unified Communications Analytics
See a Deployment Manager overview in Unified Communications Analytics.
Duration: 01:48
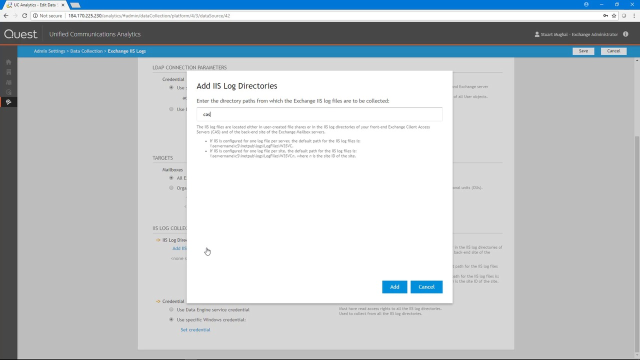
Configuring AD and Exchange data sources in Unified Communications Analytics
Learn about configuring Active Directory and Exchange data sources in Unified Communications Analytics.
Duration: 04:50
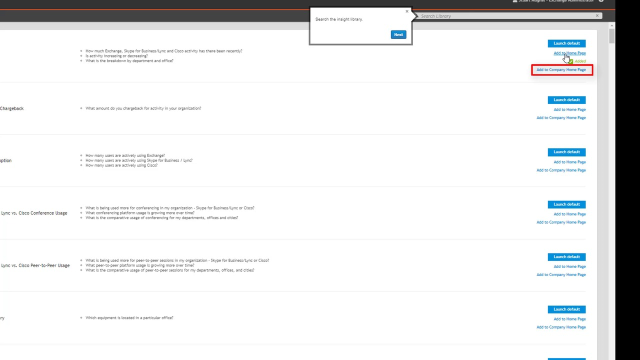
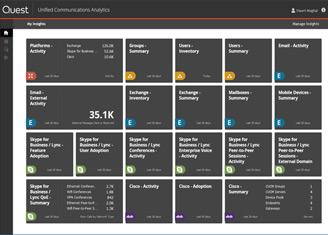
How to enable and add insights for the company home page with Unified Communications Analytics
Learn how to enable and add insights for the company home page with Unified Communications Analytics.
Duration: 01:20
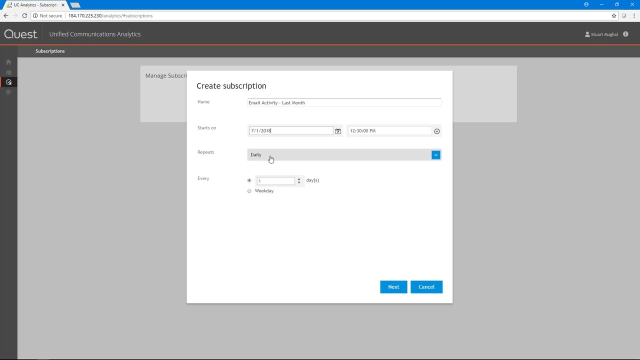
Subscription overview in Unified Communications Analytics
See a subscription overview in Unified Communications Analytics.
Duration: 02:34
Produits apparentés
Unified Communications Analytics
Recueillez, analysez et exploitez les informations relatives aux activités des collaborateurs et aux processus métier.