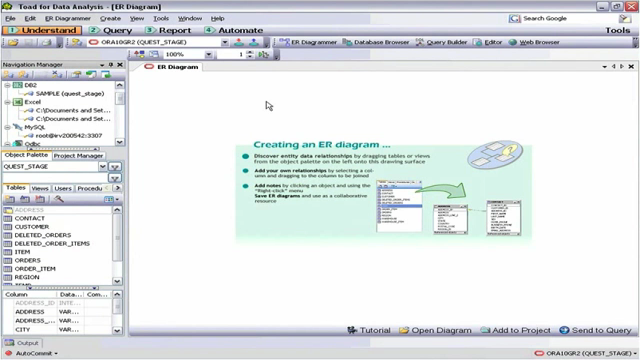
How to use the ER Diagram tool in Toad Data Point
 02:02
02:02
Related videos
Introducing Toad Data Point 6.4 for Smarter, Faster Data Insights
Discover Toad Data Point 6.4, your ultimate tool for smarter data analytics. From integrated GenAI to seamless Databricks connectivity, this release simplifies ...
01:21
Simplify Data Preparation with Toad Data Point
Toad Data Point empowers over 40,000 users worldwide with its all-in-one solution for data preparation and analysis. With support for 50+ data sources and groun...
01:06
Overview of automation in Toad Data Point
See an overview of automation in Toad Data Point, the self-service data preparation toolset from Quest that helps data analysts deliver actionable business insi...
05:41
Introduction to Toad Data Point Professional Edition
Learn about Toad Data Point Professional Edition, a solution for simplifying data access, integration, and provisioning.
03:47
How to use the SQL editor tool in Toad Data Point
In this video you will learn about the SQL editor tool in Toad Data Point, including a closer look at the toolbar, intelligent feedback, productivity tools, res...
06:25
erwin Data Marketplace for Toad Data Point Customers
erwin Data Marketplace, part of erwin Data Intelligence by Quest, provides an avenue to extend the value and reach of the datasets you prepare with Quest Toad D...
06:43