Hi, I'm Trent Mera with Quest Software. I am a systems consultant for database performance. And I want to take a very quick look with you today at what Foglight from MySQL can do in terms of showing you Galera cluster conditions on your system. So let's start by just looking at the alarms that we're watching, really, the metrics that we're watching and the alarms we can generate off of those.
If you choose one of the instances here to configure, you can go into configure alarm and you'll see we've got a category of Galera conditions that we're watching for all under this grouping here. So Galera cluster, health, disconnected, latency, flow control paused, node not ready, receive cues, send cue. So these are all things that you can see getting alerted on out here in the DB alarms column. And then you can, of course, through the administration rules section of the tool through the left navigation. You can set up email alerts on those conditions as well.
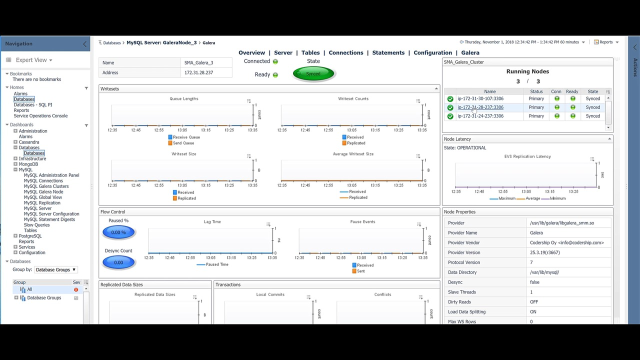
So the easiest way, probably the most obvious workflow is that right from the global databases page, if you're on a system-- let me switch to a different system here-- if you're on a system that's part of a Galera node and you click into the overview page for that MySQL server, you'll see a Galera link up here. OK, that lets you then click and you can choose which node to look at through this upper right hand side.
And you can see what's going on in terms of queue lengths, and right set sizes, and lag times, and conflicts, and things like that. But another way to get to the Galera information is this left hand side here you've got a navigation with a MySQL branch. And that's got a nice way to look at things this way. You can choose MySQL Galera clusters.
And then what's nice about this is you can have multiple clusters in this pane here. I've just got one at the time but I can quickly move around those clusters and select them and then see what's going on at a high level with their nodes. Once you do then choose one of those-- oh, one other thing I should show you, is from here as well it's an easy way to create a galera cluster summary report right from here too.
There's a lot of reporting in Foglight, but that's one of the particularly easy ways to do a Galera cluster report. But moving along with the workflow here, if you click on one of these nodes, that takes us back to the Galera cluster overview here that we saw through that other navigation. So same thing there. And then, of course, you can switch amongst each of the nodes to see what's happening on it.
And then all of these graphs that you're seeing are matched really up to whatever time range you've selected here. So if you need to see what's going on over the last four hours or what have you, you can select it and all the graphs will refresh and show you what's happening on those different nodes over whatever time period you need to understand.
So that's understanding Galera clusters with Foglight from MySQL. Thanks for your time. And please look for more of these quick videos on specific use cases for Foglight for MySQL and for all the other relational and open source and NoSQL platforms that Foglight handles. Thanks for your time. bye.
 03:43
03:43
