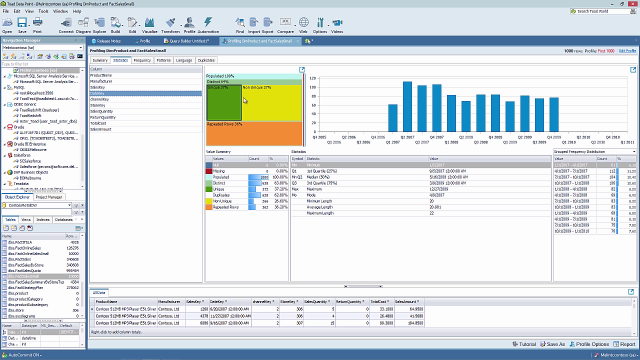
Hello, I'm Peter Evans, a product technologist consultant for Dell Software Group. And today, I'd like to talk to you about data profiling inside of Toad Data Point. Data profiling inside Toad Data Point is a new feature. Here you can see the user interface of Toad Data Point, and it allows you to build queries as we know, connect to multiple data sources. Now, one of the things that we realize with our customers is that trying to understand where the data is coming from, how that data is combined, and how it actually looks to the end user is very important.
Both of those of you that are using Toad Data Point to enable your data warehousing and business intelligence capabilities and also to use it for actually building reports for your end users, so understanding the data is very important. Data profiling, of course, is the process of examining the data available in an existing data source. Either a database or a file. And collecting statistics and information about that data.
The purpose of the statistics may be to either find out whether existing data can easily be used for another purpose, improve the ability to search the data by tagging it with keywords, assess any risk that is involved in integrating data for new applications or data warehouses including the challenges of joins. Understanding data challenges early in any data intensive project so that the late project surprises are avoided.
Finding invalidating data late in the project can lead to delays in cost overruns. Having a 360 degree enterprise view of all data. For uses such as master data management where key data is needed or data governance for improving data quality. On availability of metrics on data quality, including whether the data conforms to particular standards or patterns can all be part of data profiling.
So here I've created a very quick query using a SQL Server. I'm connecting the product table here to a sales table which we have converted. I'm given only a small counter of rows. This is just to keep the speed down so we can actually see this. So we've executed the SQL. We have results that back. You can see that I've got 10,000 rows. And what we'd like to do now is understand more about this data set in these tables.
We'd like to understand how they're formed, what the type of duplicates that may be involved, what type of data styles, we've gotten data types, and how they can help us what we're trying to do with our data. So very quickly, we can right click, Send to, and actually push the data that we have to data profiling.
This immediately opens another tab within Toad Data Point, and then starts to provide us with features through the data. So here I can look at particular columns. I'm looking at how many rows are unique, how many rows are non unique. How many rows are being repeated. How many rows have no data, or how many rows have missing data. The legend on the right side explains what you're actually looking at.
An example of the data at the top shows you what type of data is within those actual fields. If you go to the Statistics tab, you can see a view of each column, and that column obviously moves the statistics for that column as you scroll through the actual columns. Here we have the date key. It's showing that the field is actually populated 100%. There are 64% distinct values. 37% percent unique values, and 27% non unique. And within the data, there are 36% percent of data that are actually run as a repeated row.
On the right hand side, you can see a graphical imputation of actual data. You can see value summaries with actual graphical interpretation below, and then within the statistics, you can see the minimum, the Q1, the minimum for Q2, the median percentiles of each actual area and each varied type of data. And you can also see the grouped frequency distribution on the right hand side.
If we go to the frequency tab, we can actually see how the top values, bottom values, first values, and last values in this data match. So you can see the number of times by count, how many times Adventure Works 20 inch CRTTV VE 15 White has turned up. That gives it a percentage of 1.3%. The bottom values you can actually see that not 0.1% percent is the [INAUDIBLE] GB super slim. This gives you an idea of how the spread of data is across your data and allows you to understand. You could look at patterns within your text fields.
Obviously, when you go to a key field or date key field, those patterns aren't available. They're only available for varchar fields, i.e. text fields, and it shows you what type of patterns are actually being delivered. You can look at the languages that are actually being used, so for instance, ASCI lowercase letter, 23,000 variations of that are actually being used within the data. You can go to duplicates, and you can check on each field. How many times that duplicates are actually being run. So if I, for instance, select here and actually check for duplicates on the bottom right hand corner, we'll see that I'm actually getting duplicates coming back and there are 959 rows of duplicates within the data.
So you can here see I've got Adventure Works 13 inch color is a duplicate, and there's a count of six of them within the actual data. So how to do data profiling and what you're actually using data profiling for? Well, data profiling utilizes different kinds of descriptive statistics as we've just seen such as minimum, maximum, mean, or mode, percentile, and standard deviation.
This is all based on aggregates such as count and sum, and additional metadata information is obtained during data profiling,