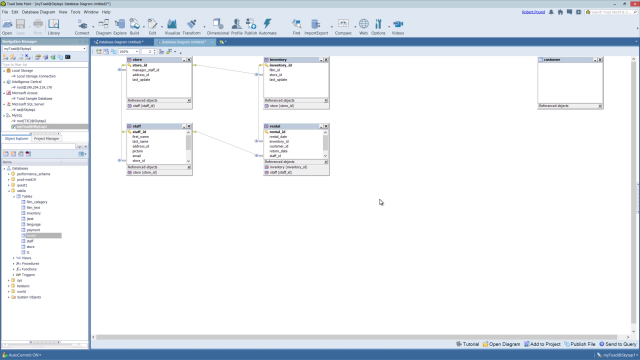
Overview of the diagram tool in Toad Data Point
 07:40
07:40
Related videos
Introducing Toad Data Point 6.4 for Smarter, Faster Data Insights
Discover Toad Data Point 6.4, your ultimate tool for smarter data analytics. From integrated GenAI to seamless Databricks connectivity, this release simplifies ...
01:21
Simplify Data Preparation with Toad Data Point
Toad Data Point empowers over 40,000 users worldwide with its all-in-one solution for data preparation and analysis. With support for 50+ data sources and groun...
01:06
How to backup and restore data in Toad Intelligence Central
This video demonstrates how to backup and restore data in Toad Intelligence Central.
02:32
Enhancements to the Transform and Cleanse window in Toad Data Point - Part 2
See some significant enhancements on how you store, organize and share the transformation rules that you create while using the Transformation and Cleanse windo...
01:28
Toad Data Point Import/Export Wizards
Watch this short demo of how to use the import and export wizards in Toad Data Point
04:17
Query Builder date ranges and bind variables in Toad Data Point
Learn about using date ranges and bind variables in the Query Builder in Toad Data Point.
08:34
Overview of Toad Intelligence Central
Learn how to make data provisioning more efficient in this overview of Toad Intelligence Central.
09:04
Overview of the profile tool in Toad Data Point
In this video you will learn about the profiler tool in Toad Data Point, the solution from Quest that lets you streamline data access, preparation and provision...
08:04
Overview of automation in Toad Data Point
See an overview of automation in Toad Data Point, the self-service data preparation toolset from Quest that helps data analysts deliver actionable business insi...
05:41
Introduction to Toad Data Point Professional Edition
Learn about Toad Data Point Professional Edition, a solution for simplifying data access, integration, and provisioning.
03:47
How to use transform and cleanse in Toad Data Point
Learn about transform and cleanse in Toad Data Point, a self-service data preparation toolset from Quest that helps data analysts deliver actionable business in...
06:19
How to use the SQL editor tool in Toad Data Point
In this video you will learn about the SQL editor tool in Toad Data Point, including a closer look at the toolbar, intelligent feedback, productivity tools, res...
06:25
How to use data profiling in Toad Data Point
This video demonstrates how to use data profiling in Toad Data Point.
07:22
How to use automation scripts in Toad Data Point
Learn how to use automation scripts in Toad Data Point, part of Toad Business Intelligence Suite.
06:31
