
Performance Investigator (PI) collects a lot of workload and performance data about the activity which runs within a database instance. This information is saved in the PI embedded repository which is separate from the Foglight repository. As a result, the PI data is only presented in the PI dashboard and is not available for custom dashboards and reports as other information collected by the Foglight cartridge is.
To address this problem, several custom views have been created. They allow building custom dashboards and reports to provide more flexibility in consuming performance information.
This article describes the views available and provides instructions on how to use them.
Note: Information presented is relevant for both Foglight for SQL Server and Foglight for Oracle, unless otherwise indicated.
The following custom views are available with the SQL Server and Oracle database cartridges:
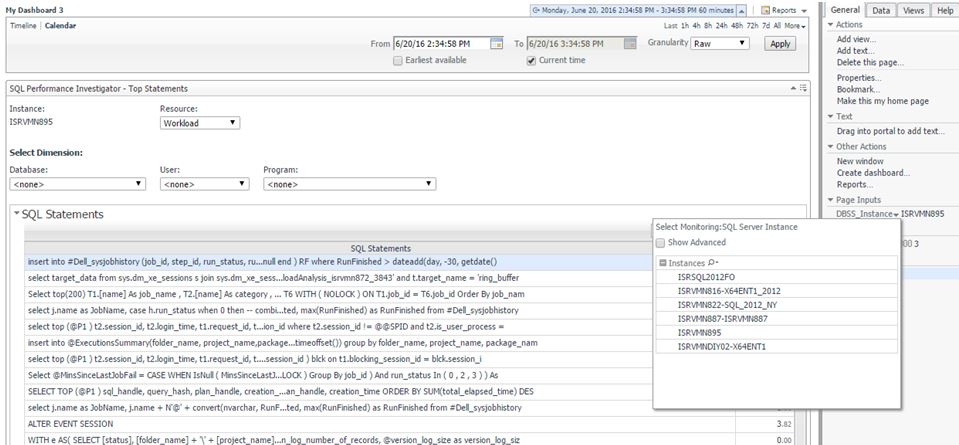
- Top SQL Statements - Show the top SQL statements by active time in a certain instance during selected time frame. Allow the statements to be filtered by Database, User, Program or combination of all
- Top Batch - SQL Server only. Show the top Batchesby active time in a certain instance during selected time frame. Allow the batches to be filtered by Database, User, Program or combination of all
- Wait Events - Show the top wait events occurred in an instance for selected timeframe
These views take the instance name as a parameter, and each view can be made into report and scheduled to run periodically.
Here is a step-by-step explanation of how to create custom dashboards using one of the PI views.
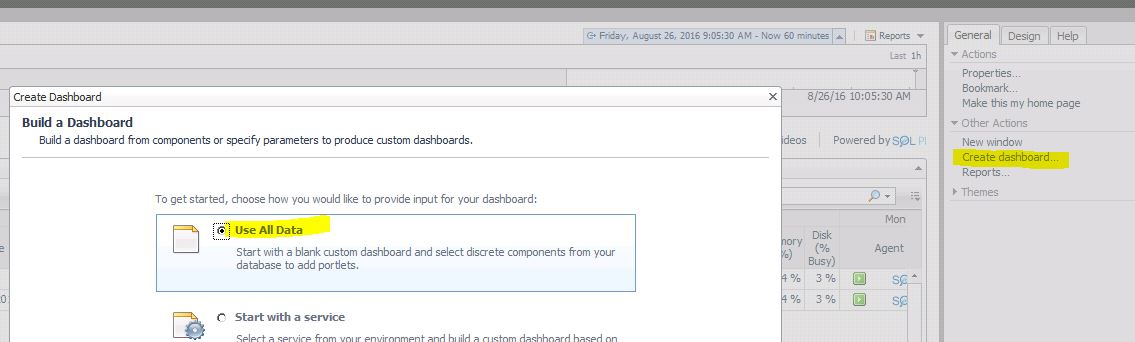
- Create a new dashboard and select “Use All Data”
- Press "Next" and give the custom dashboard a name
- Press "Next" and select layout
- Press "Finish" and then "Cancel"
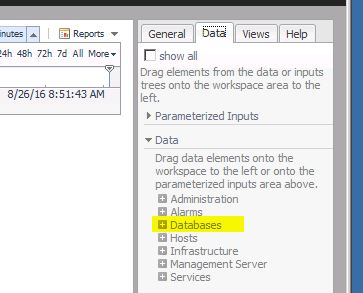
- Go to the Data tab and select “Databases”
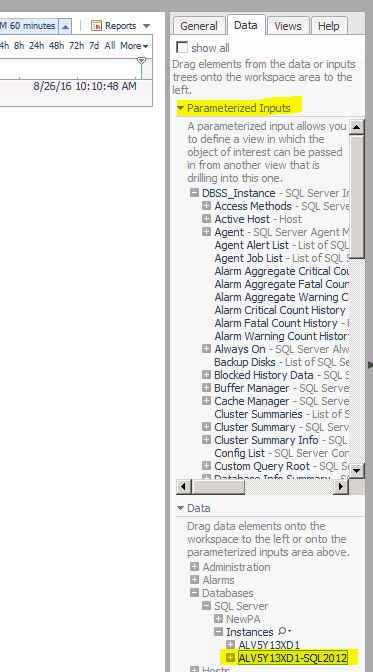
- Find “Instances” and drag the required instance to the “parameterized input” on the upper level of the screen
- Go to the general tab and press “Add View”
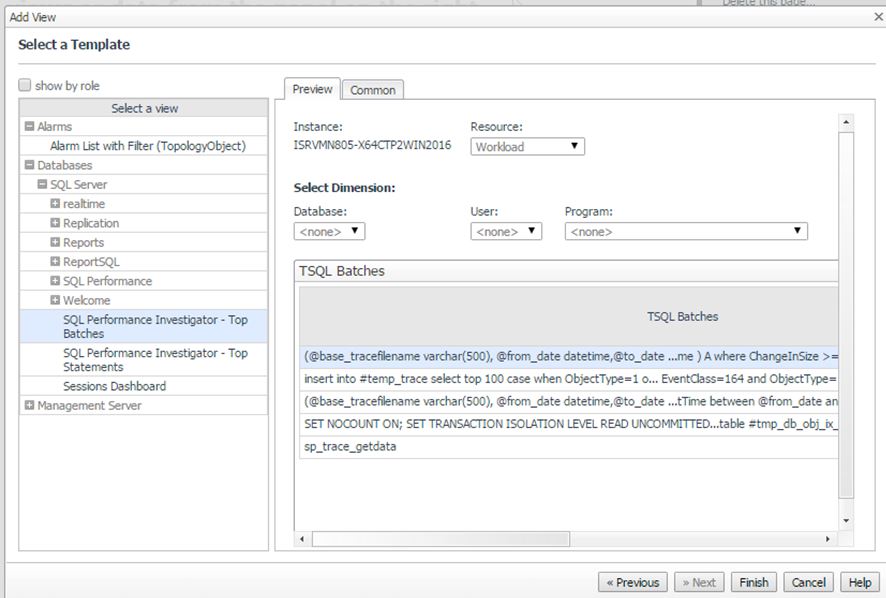
- Choose “Select a View Template” and press “Next”
- Uncheck the "show by role" checkbox, then expand the “Databases” tree and select the required view: Top batches or Top Statements.
- Press “Finish”
- The Dashboard is complete. It is possible to change the instance selected on the right pane
- a view for wait events is also available under " SQL Performance", but the instance name cannot be a parameter - the instance selected when adding the view, will be the one used
Create report based on PI views
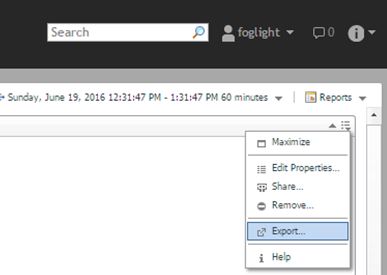
- To create a report based on the view, it is possible to click on the icon on the right hand side of the table and select "Export":
- In the pop-up press "Next"
- Press "Save as Report" to create the report
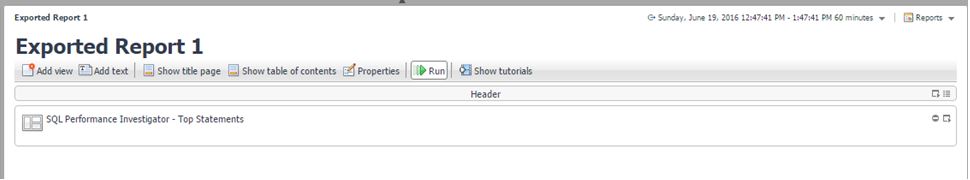
- To schedule the report, select "Run" in the Exported report dashboard created:
- Follow the parameters requested to run the report for interval suited for you and to schedule it properly. for example: if you wish the report to be generated each hour, select "Last Hour" for the report "Time Range" parameter, and then schedule it "Hourly" on the Schedule screen.
- Once the report is created, you can manage and see all reports created under the "Manage Report" dashboard
