
User-Defined Collections enable you to tell Foglight for SQL Server to go beyond the data points it collects out-of-the-box to also collect the results of queries that you define. So in addition to the vast amount of commonly-needed metrics that Foglight starts to collect as soon as you install and run it – you can gather and use additional metrics that are important in your particular environments and applications.
If you’re like me, you’d rather see a quick walk-through of a feature than scour a comprehensive doc, so the purpose of this post is to provide a basic tour of the navigation to get you up and running quickly with creating and using your own User-Define Collections in Foglight alarm rules and reports:
Setting up the Collection
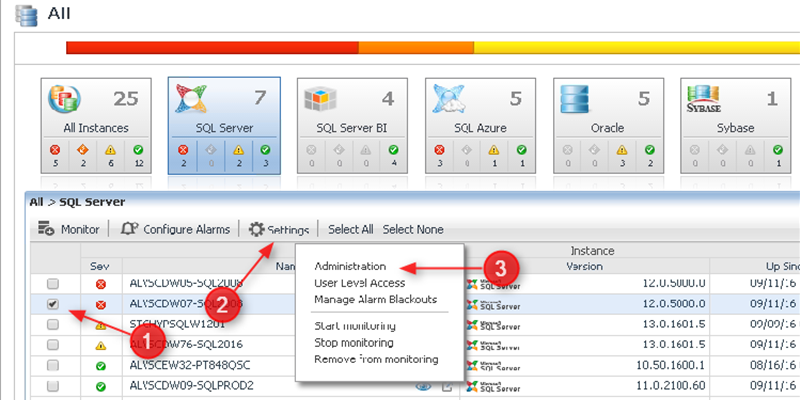
1. User Defined Collections (UDCs) are reached by selecting one or more instances from the Databases page and choosing Settings > Administration…
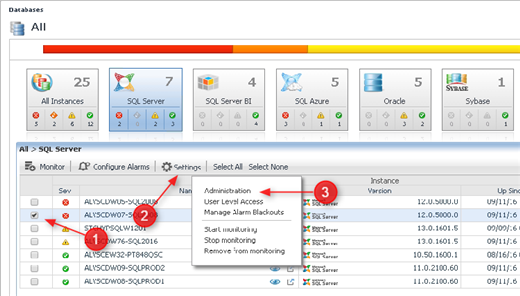
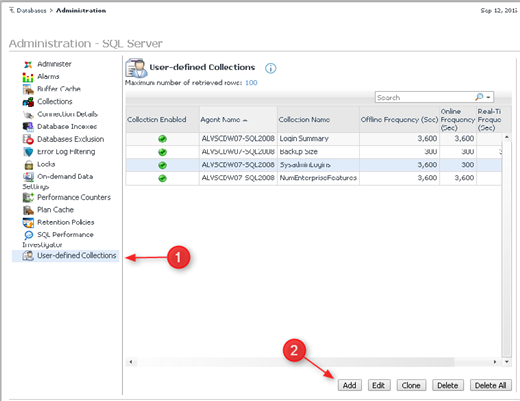
…and on the page that follows, choosing User-defined Collections, and Add, to create a new one:
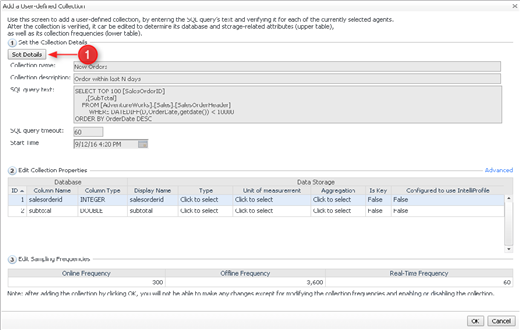
2. This will bring you to the “Add a User-Defined Collection” dialogue. Choose Set Details and supply the name, description and SQL text of your collection, and then click Verify to make sure the collection works. Once you’ve returned to the “Add a User-Defined Collection” dialogue, notice that you can also set the frequency with which Foglight runs the collection. Once you have that set, click OK:
Viewing the collected data
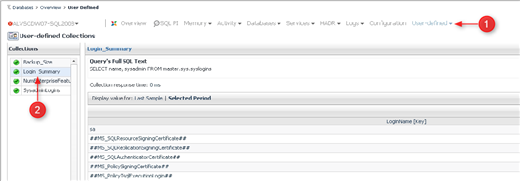
To view the current result of a UDC, navigate to the Overview page of an instance and choose User Defined > Collections. This will take you to a drill down that shows you a list of all UDCs. Simply click on the one that you would like to see the results for:
Using the collection in Alarm Rules and in Dashboards and Reports
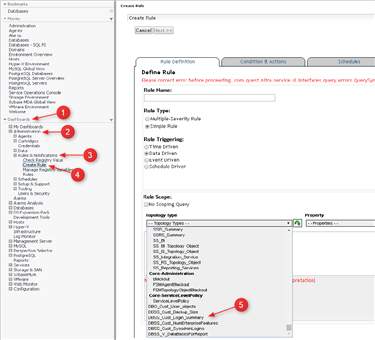
To use your UDC in an alarm rule, in the left pane navigate Dashboards > Administration > Agents > Rules & Notifications > Create Rule. UDCs can be found at the very bottom of the Topology Type drop-down list. The name of the UDC will be prefixed with “DBSS_Cust_”
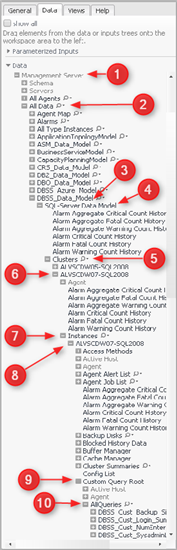
The data returned by the UDC can be used in custom Dashboards and Reports by navigating in the Data tab in the rightmost pane (the Data tab will appear once you’ve started to create a custom Dashboard or Report):
Management Server > All Data > DBSS_Data _Model > SQL-Server Data Model > Clusters > Agent (Instance) Name > Instances > Agent (Instance) Name > Custom Query Root > All Queries > DBSS_Cust_(UDF Name) > QueryResults
As is the case with rules, the name of the UDC will be prefixed with “DBSS_Cust_”
Where to go next…
While this post mentioned alarm rules and custom reports, the purpose here has not been to provide detail on those topics, but just to show how User-Defined Collections can be used in in those contexts. For additional detail about alarm rules and custom reports, please look for specific Foglight for SQL Server resources and support services.
All of my Quest Database Performance blog posts can be found here.
