Change Auditor leverages Event Tracing for Windows (ETW) for recording SQL events, the SQL startup flag t1906 instructs SQL Server to read the tracing templates stored in the “..\Program Files\Microsoft SQL Server\MSSQL11.MSSQLSERVER\MSSQL\Binn\etwcnf.xml” (default instance) file directory on the SQL Server, (figure 1). This file contains a list of event IDs used by the Trace Provider.
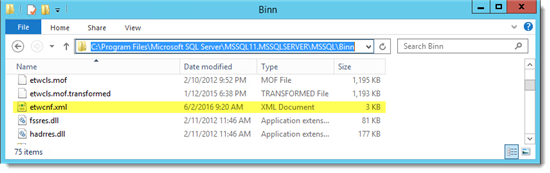
Figure 1
The Change Auditor agent reads the Provider configuration (etwcls.mof figure 2) and creates an Event Tracing Session called “NPCA_[InstanceName]TRACE” (‘InstanceName’ is the name of the SQL instance being traced) visible in the Performance Monitor, (figure 3).
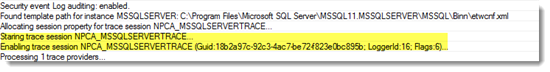
Figure 2
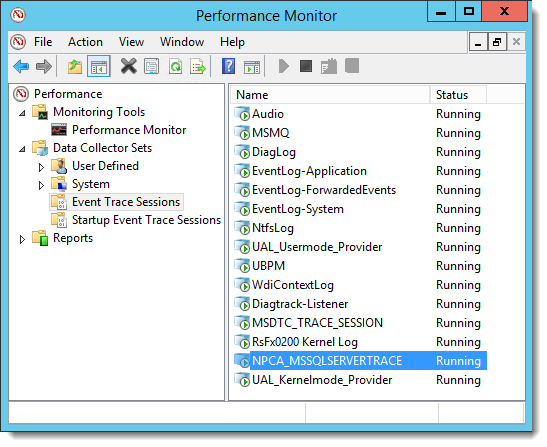
Figure 3
Type “C:\>logman query providers” in the “Command Prompt” for a list of trace providers. The list may be redirected to a text file for clarity. All other providers except for SQL, were removed (for clarity) from the example output list shown in figure 4 below.
Each trace provider typically has a unique GUID.
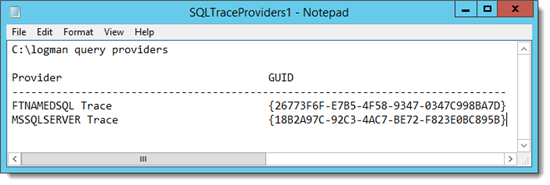
Figure 4
To avoid issue when configuring a Change Auditor SQL Audit template, the name(s) in the Provider list must match the name(s) configured in the template, (Figure 5).
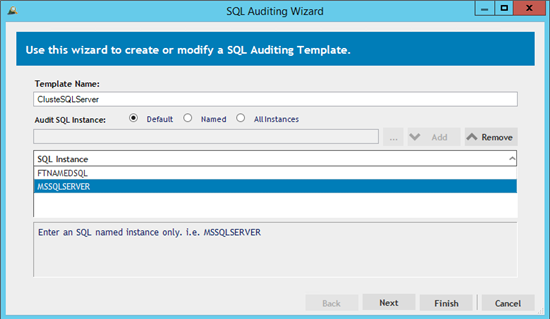
Figure 5
The DBCC TRACESTATUS(-1) may be executed in SQL Management Studio to get the status of all trace flags. The Startup flags are always “Global” (1) so the value for t1906 will always be 1 for “Global “and the “Status” value should be 1 for “Enabled”, (figure 6).
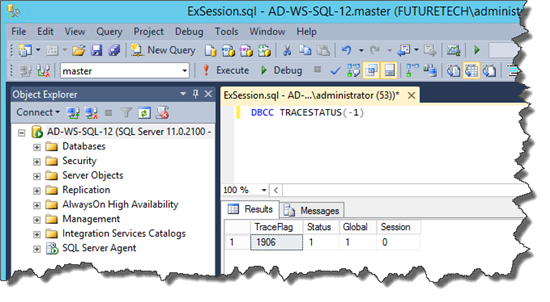
Figure 6
Trace events are normally written to memory buffers, however the Event Tracing Sessions may be configured to write to a file for trouble shooting. These files are binary *.etl files which may be converted to human readable form using the tracerpt.exe utility.
Impact:
Event Tracing for Windows provides comparatively low overhead tracing. It normally consumes less than 5 percent of the CPU and can record up to 20,000 events per second. It uses small Buffer chunks with sizes that are calculated as a function of the Physical memory, so it should have little impact on an environment with the default Trace Session settings.
Conclusion:
Having a good working knowledge a of Event Tracing for Windows and how it relates to the SQL native SQL processes is the best way to reduce down time or prevent problems with Change Auditor for SQL auditing.
Suggested reading:
Data Access Tracing in SQL Server 2008
Be sure to check out the Change Auditor Product Support page to find solution articles, tips and tricks, tutorials, documentation, notifications, lifecycle tables, training, and a product user forum.
