
I often get stunned silence when I present how to profile PL/SQL objects using Toad for Oracle’s PL/SQL profiler. Using Toad’s Profiler is a fast and easy way to find bottlenecks in PL/SQL code, esp. SQL statements, and determine next steps to tune and eliminate those bottlenecks. Simply put, Toad for Oracle provides a GUI on top of the DBMS or Hierarchical profiler packages that Oracle provides to store historical code runs.
Setup is quite easy and all Toad for Oracle Profiling objects can be created in a standard TOAD schema for ease of management. Reed more details on how to setup PL/SQL Profiling. The decision on whether you want to use DBMS (Oracle 8i and up) or Hierarchical (Oracle 11g and up) profiling is strictly up to you or your DBA’s preference.
Once setup is complete, you can start profiling your PL/SQL in Toad’s Editor. Execute your code in debug mode by clicking one of the Debug toolbar buttons or Debug menu items. Options include Run/Execute, Step Over, Trace Into or Trace Out. You will then need to toggle PL/SQL Profiling to the ON position to log profiling results in the Set Parameters and Execute dialog box (Figure 1).
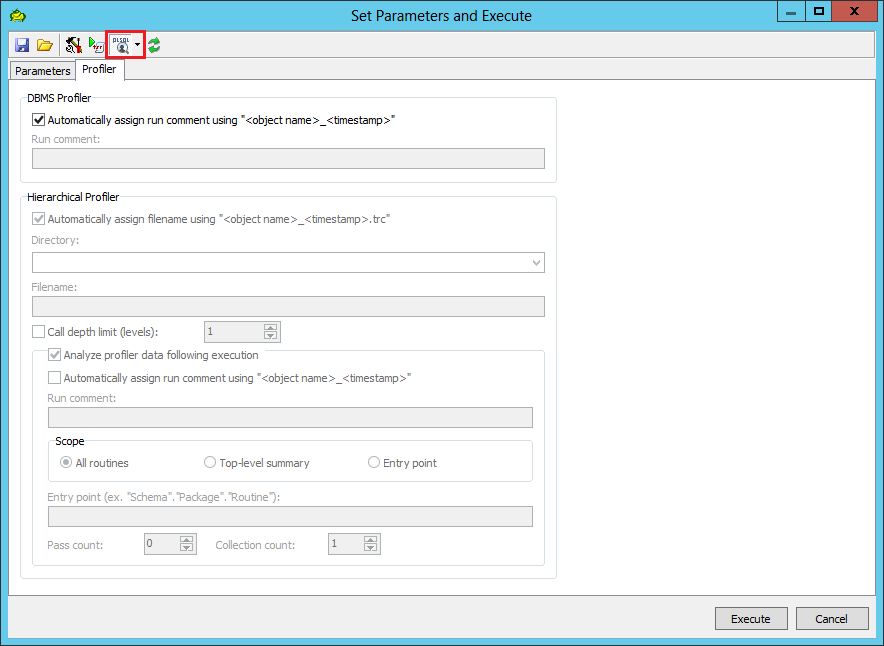
Figure 1. Enabling PL/SQL Profiling
After your PL/SQL code executes go to the Profiler tab (Figure 2) and hit the green Refresh icon.
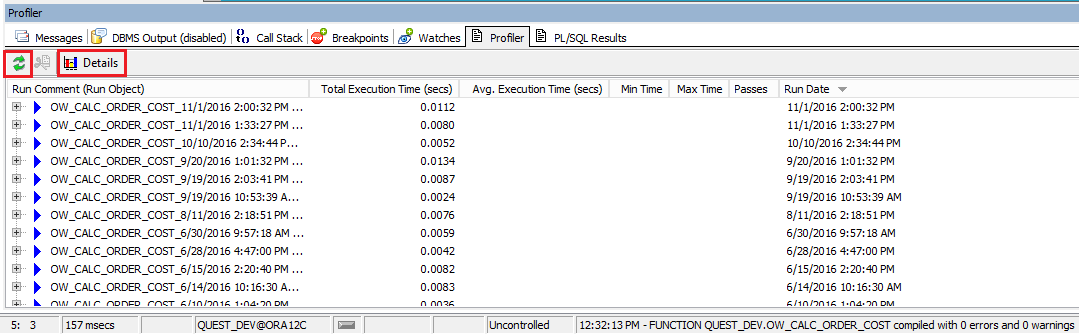
Figure 2. Profiler tab
You can sort the Profiler results grid to see the most recent Run Data at the top. Then you can expand each run and see a breakdown of how long each line of code took to run in seconds. You can get a graphical view of this by clicking on the Details icon which will display the Profiler Analysis screen (Figure 3).
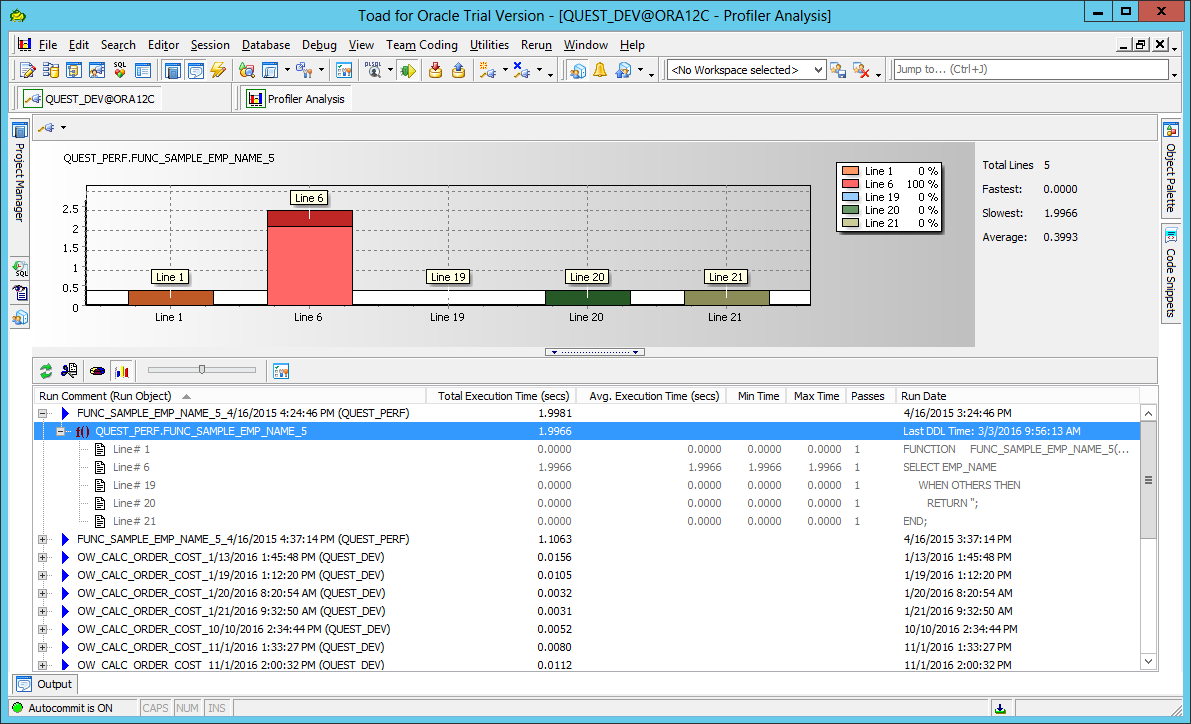
Figure 3. Profiler Analysis screen
The Profiler Analysis screen makes it easy to see in graphical form which profiled PL/SQL code took the longest to run but also quickly identifies which line of code took longest. For example, if it’s a SQL statement causing the bottleneck then you can use the SQL Optimizer for Oracle to tune it. Or maybe it’s a looping mechanism that goes on infinitely because of some semantic error. Whatever the performance issue is the PL/SQL Profiler can help you identify it so you can effectively and efficiently tune your code.
If you’d like more information on anything Toad, please visit ToadWorld.com for more information and resources. Cheers!
