

DevOps is everywhere, seemingly permeating every aspect of IT. The way that companies are building and managing their applications has become increasingly agile, and many of the comforts that DBA's used to rely on are no more. Specifically, DBA's used to find comfort in knowing that very rigid change control processes would limit the likelihood that a production database server would experience a change, potentially causing performance headaches. Changes which used to be deployed all at once, and once a month, are now deployed multiple times a day. Also, DBA's used to be able to find comfort in the fact that their developers were completely walled off from their production environments, stuffed into the safety of a development server. Due to the frequent changes that can happen in production, developers now need real-time feedback into how those changes may be impacting the health of the application so that if performance goes south, the change can be backed out as quickly as possible.
Luckily for our customers, Foglight for Databases can allow database administrators to more actively participate in the DevOps culture of their organization, bringing comfort back into their day to day duties. This post will serve to introduce two capabilities, Change Tracking and Custom Shared Dashboards which deliver on this goal.
Change Tracking
As mentioned above, gone are the days where production changes were made under heavy scrutiny. Changes would be presented in front of a panel of experts, they would then be tested over weeks and months, and only after this rigorous process would they be deployed, sometimes as infrequently as once per quarter. The "Fail Fast" principle of DevOps now encourages changes to made quickly, so that if something fails, it's easy to diagnose, and theoretically fix. This becomes a significant challenge for Database Administrators, those that are ultimately responsible for the health and performance of a database server.
Foglight for Databases (specifically SQL Server and Oracle), provides a Change Tracking feature in the Performance Investigator (SQL PI) drilldown, which will very clearly show what is changing, and because the change event is overlaid on top of a workload graph, DBA's can visualize the impact of that change. This can assist with "reactive" problem detection, in that if a change occurs that causes a performance problem, the DBA will quickly realize this and be able to work with the development team to back out that specific change. This also helps with more "proactive" diagnostics in that after a change occurs, a DBA will be able to view the before and after status of performance. If things start to trend in an unhealthy direction, they can work to fix the problem before it affects end users.
Below you can see a screenshot of Change Tracking in action, highlighting a specific configuration, schema, and/or execution plan, and how it may have impacted performance:
![]()
For a very detailed walk through of Change Tracking in action, please visit my colleague Dave Orlandi's blog here!
Shared Custom Dashboards
DevOps workflows are greatly improved by proving immediate feedback about performance, directly to those responsible for writing the application code. The "Fail Fast" principle only works if the problem can be detected and resolved very quickly after the failure. Traditionally this has been difficult, as developers rarely have any access to view performance data about how their code functions in production. The database vendors themselves typically require direct access to the database server (and in many cases administrator level access) in order to view performance data, and developers rarely (for good reason) have this access. Monitoring tools, theoretically, should help here, however most monitoring tools provide dashboards and interfaces designed for admins, not developers. They include information not relevant for development use cases, and also may provide data about systems that certain developers should have no ability to see.
First off, Foglight provides a "User Level Access" control, that enables an administrator to provide full access to Foglight's dashboards and drilldowns, but only for a restricted set of servers. If a DBA wishes to allow a developer to look broadly at the health of a database server, but only the servers that they are directly responsible for, that can be accomplished using the configuration option shown below:
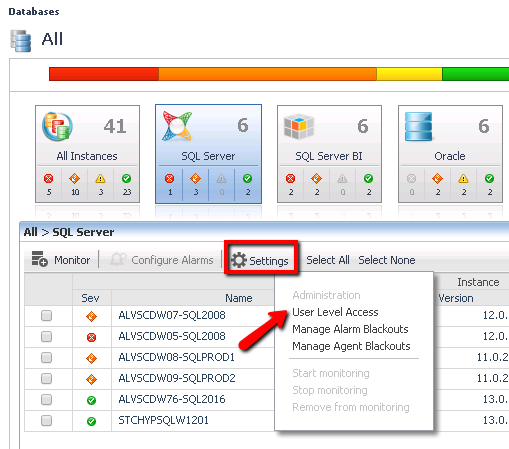
For a more detailed walk through on how to configure User Level Access, please visit the blog written by my colleague Ben Boise here.
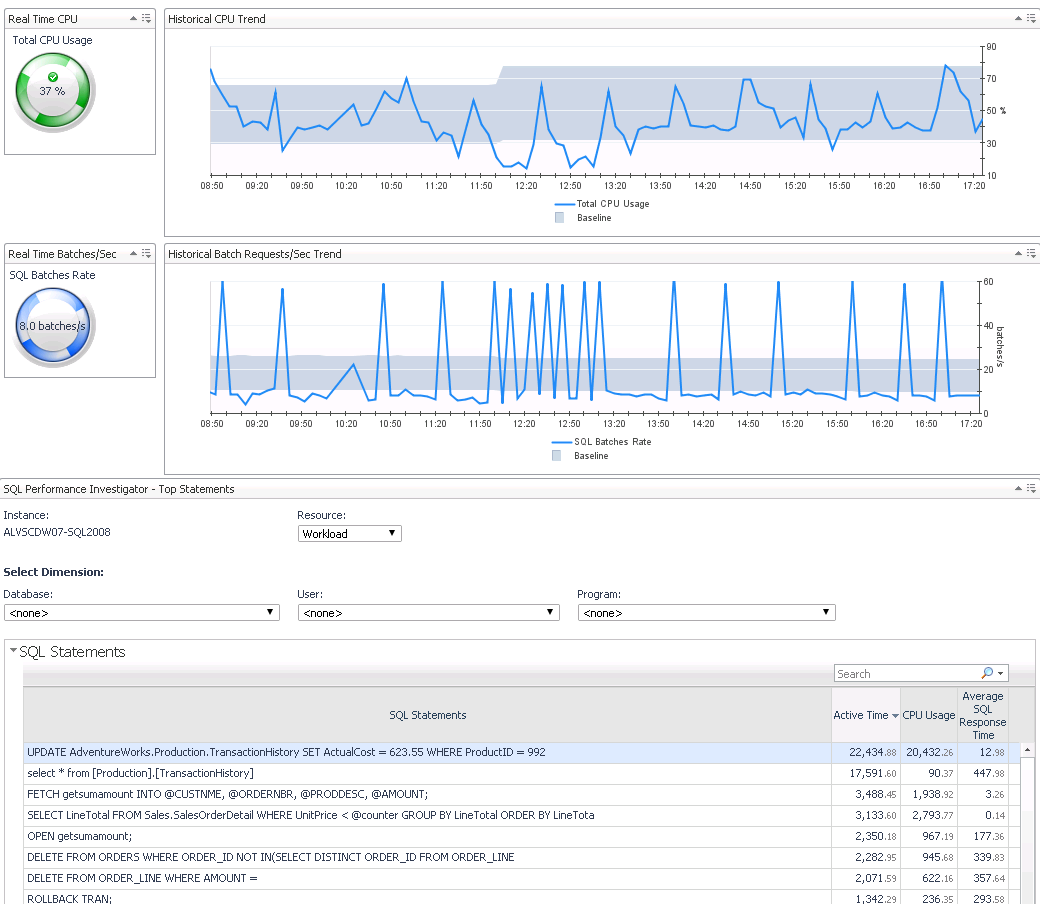
Beyond this however, many admins may wish to provide developers with visibility into not just a subset of servers, but also a very specific set of diagnostic information. For example, a DBA may not want to share visibility into backups, clustering, disk space, event logs, etc... but may be interested in providing performance metrics, and a list of top SQL statements. Foglight supports the creation of custom dashboards, with a simple drag and drop designer. Using this interface, a Foglight administrator can build a dashboard which includes whatever information they wish, and that dashboard can then be presented to a developer via a URL, so they can now view that information, whenever they wish, in real time, with no manual intervention from the DBA. This not only enhances a customer's DevOps related visibility, but it also frees up the DBA from spending their time responding to ad-hoc requests for information from the development teams. An example of one of these dashboards can be found below, showing trend graphs and real time gauges of key performance metrics (CPU usage and Batch Requests/Second), along with a list of top SQL Queries. For more information on how dashboards like this can be created, please view our archived webcast found here (https://joinquest.webex.com/joinquest/lsr.php?RCID=5a0481096d4aab8eb2c2b5b93979b034).
There's much more to offer in Foglight, but hopefully this post has offered some insight into how Foglight's database monitoring can help you, and your company accomplish your DevOps initiatives. For more information about Foglight, and to download a free trial, please visit the product page below: