
I recently showed a customer how to modify the thresholds and severity levels of Database alarms by using the Foglight for Databases administration dashboard. A follow-up question was about how to do the same thing for alarms that were appearing for page in/out rates, interrupts and memory utilization. Since I'm somewhat familiar with Foglight after almost a 13 year relationship, I knew right away that these alarms were coming from the operating system. A different approach to modifying their behaviour would be required.
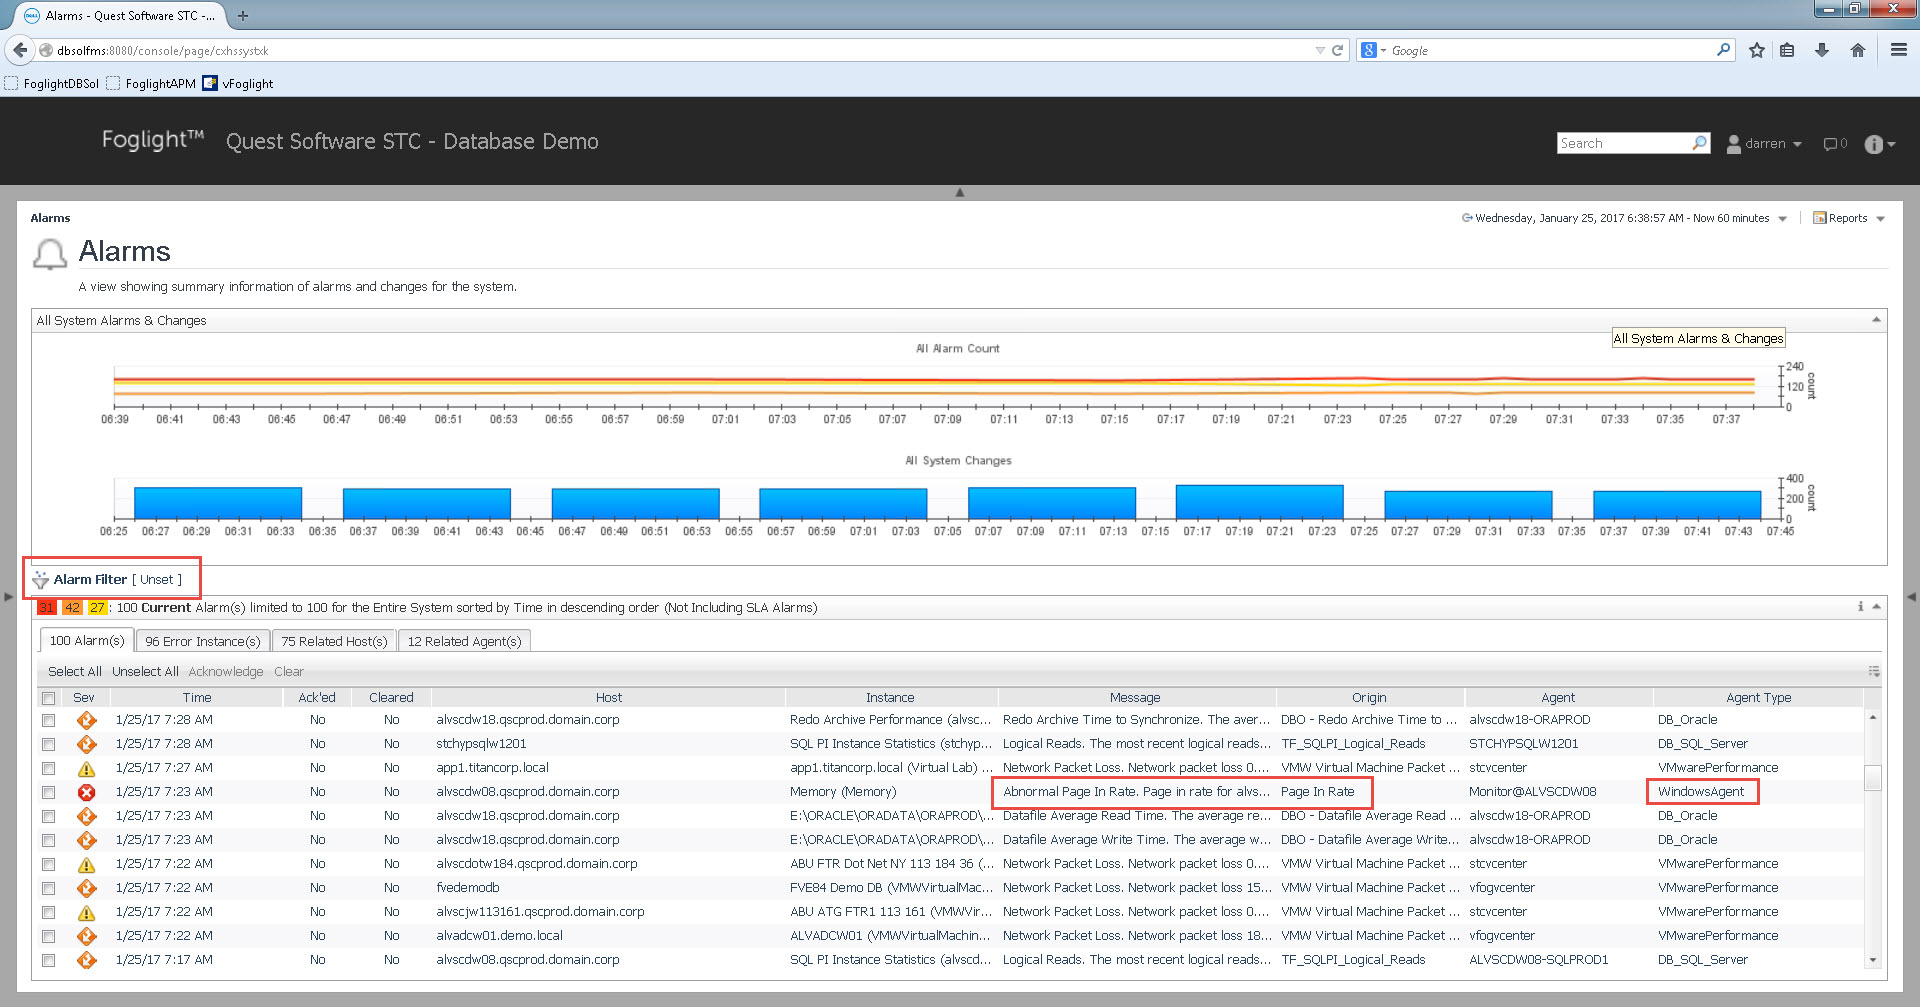
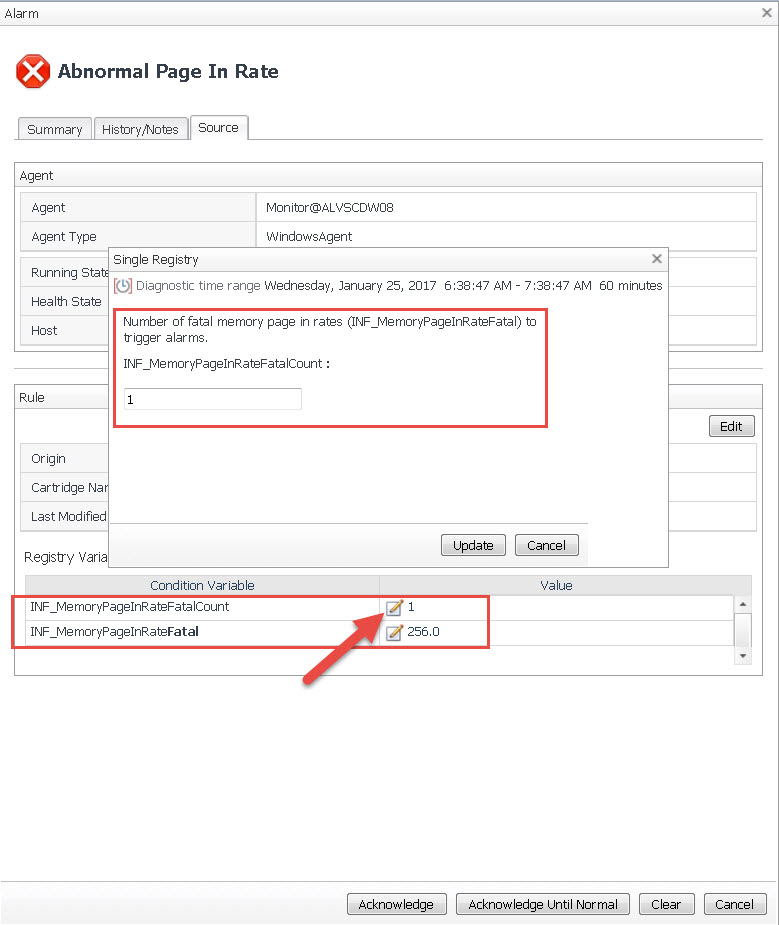
Start by either clicking on the alarm message when you see it on a dashboard or navigate to the Alarms dashboard. You can filter and search for current or historical alarms, keywords in the alarm, etc. The point is to find the alarm that you wish to modify. The Page In alarm is circled below, and the Origin column confirms that it is from the WindowsAgent (OS).
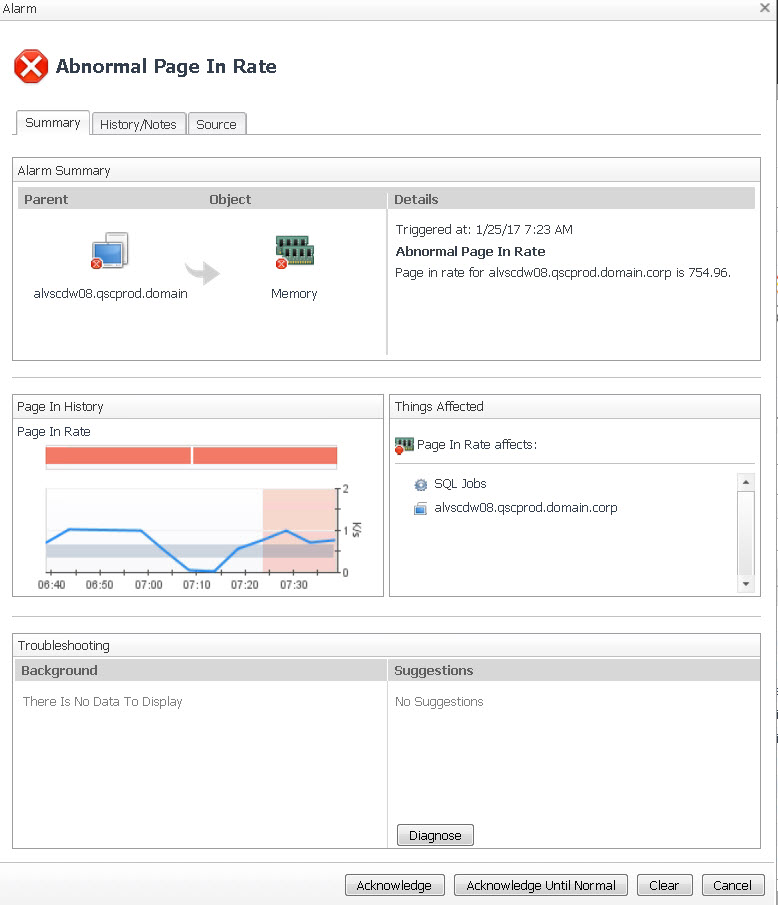
Clicking the alarm message brings us to many details about the alarm.
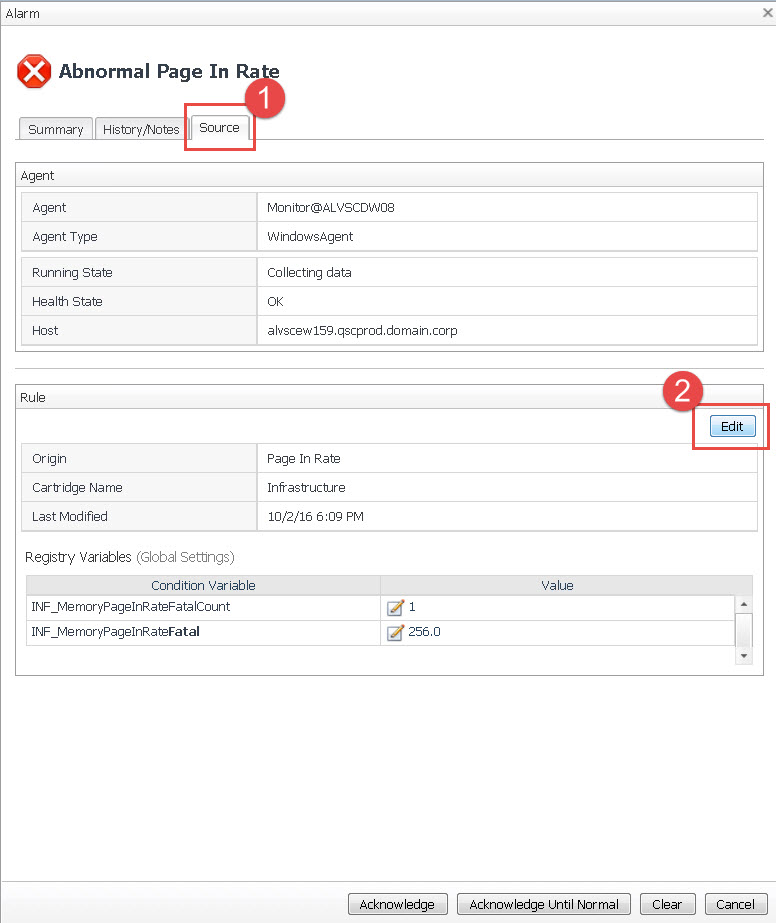
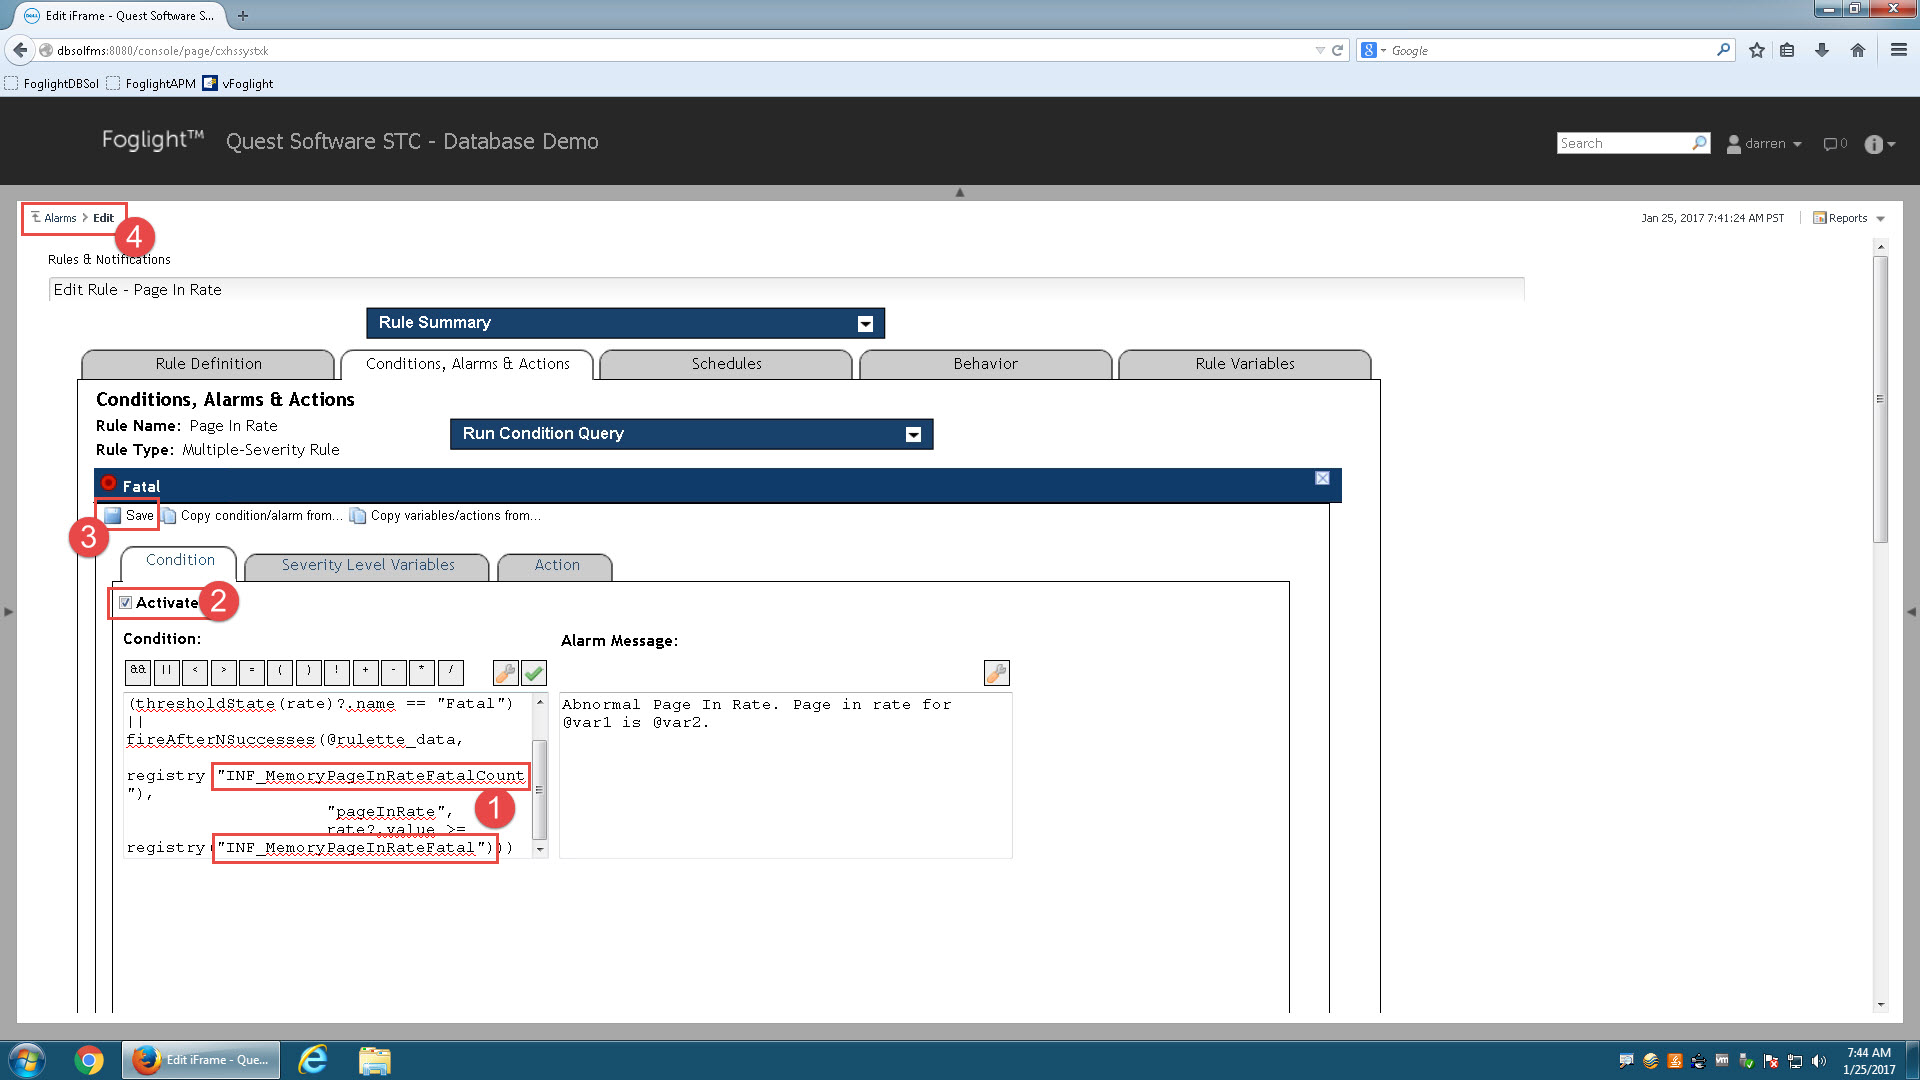
Navigating to the Source tab and clicking Edit will show us the Rule Editor which has the code and more details for the alarm logic.
This is a multiple-severity alarm with all of the severities activated. Expanding the Fatal severity will show the details just for that level.
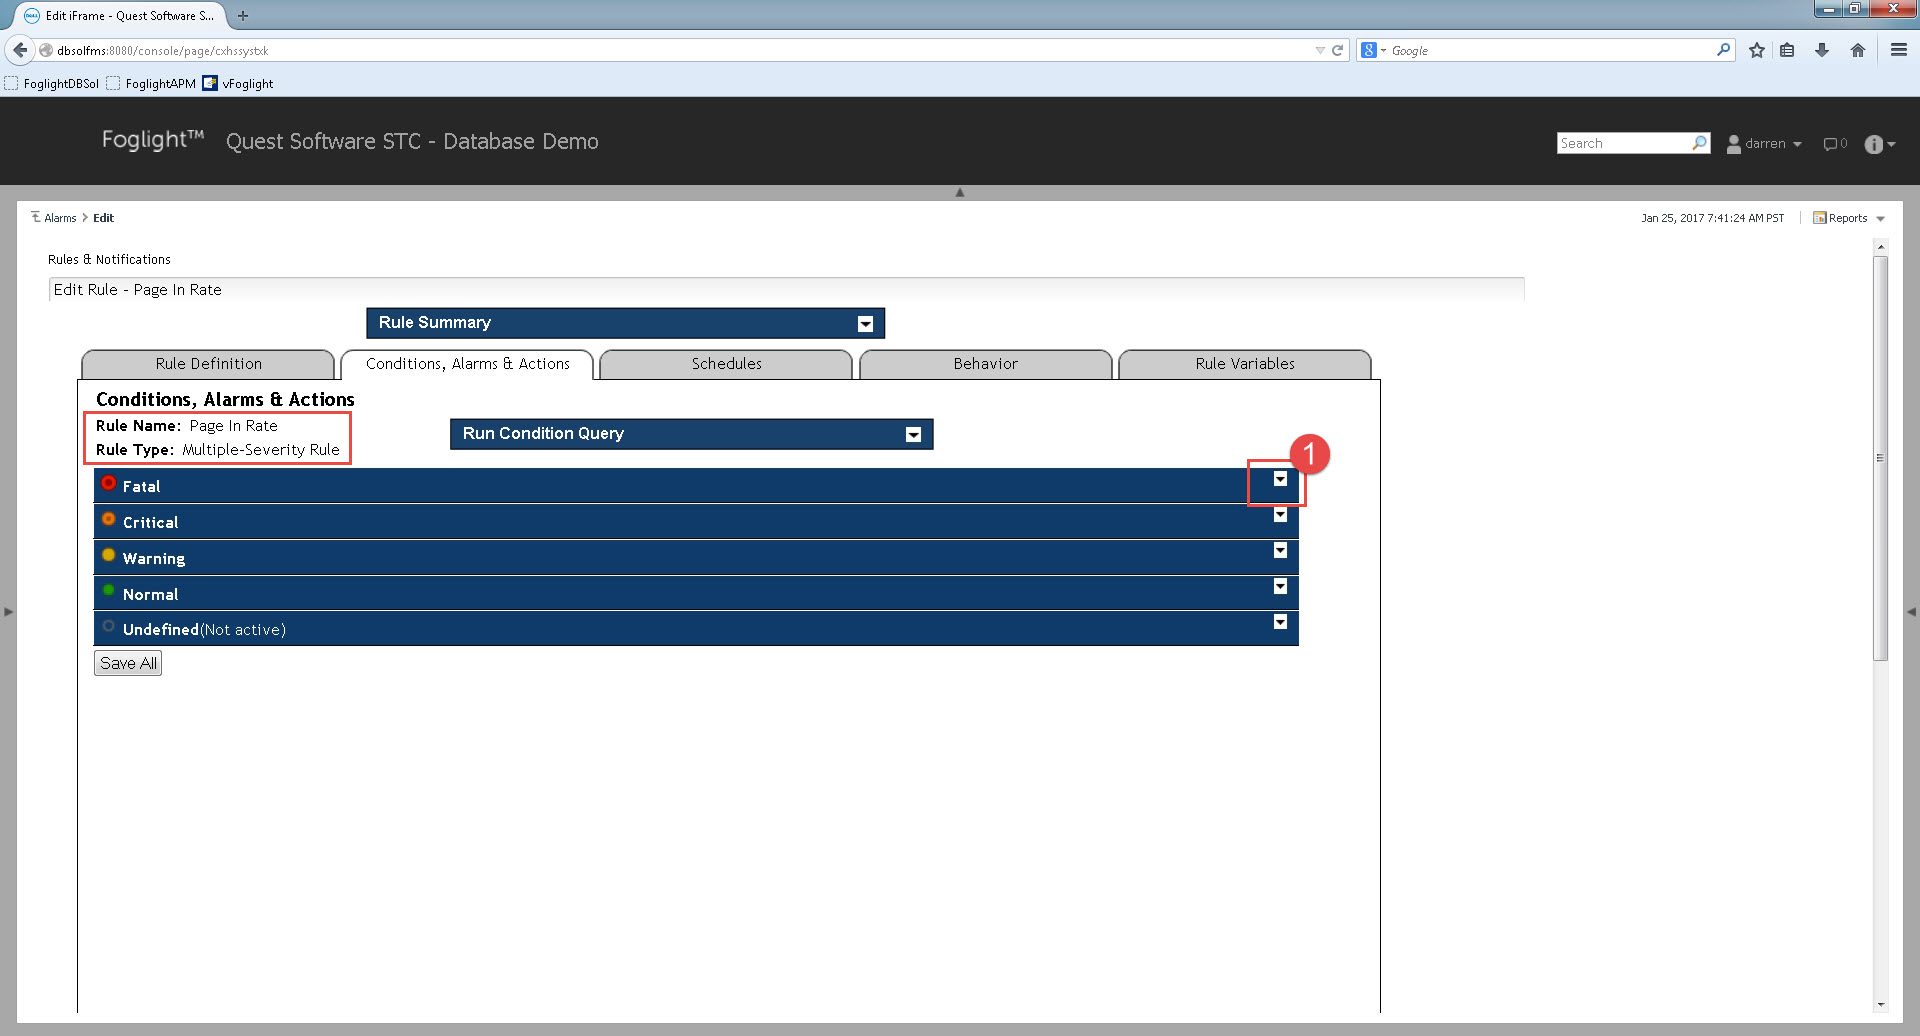
There is a lot going on here. #1 in the image below shows a couple registry variables. These are conceptually the same as Windows registry variables. They have a name, datatype, and globally (and sometimes locally) scoped values. Instead of hardcoding a value (eg. 256) into the rule, the registry provides more flexibility. The registry values can even be scheduled so they have different values at different times of the day. But that's another topic..
#2 shows us that the fatal severity is active. If you want to disable a particular severity level, uncheck the box and then click save (#3).
Finally, the breadcrumbs (#4) will take us back to the prior dashboard to continue on.
Back on the alarm message, source tab, we can now make sense of the condition variables at the bottom of the screen. Those look to be the same names that we saw in the image above! Clicking the Edit icon will allow you to see what the registry variable is used for, and to modify the value.
CAREFUL! These are global values that are used for all instances of this rule.
So there you have it. From seeing an alarm appear on a dashboard, you can quickly get down to the details to modify severity levels and the values at which they are triggered.
