
A customer recently asked if there was a way to find the top application servers that were placing load on their database instances.
With Foglight Performance Investigator, it is very easy.
Start with the usual tasks - setting the time range and specifying the top X dimension entries to display.
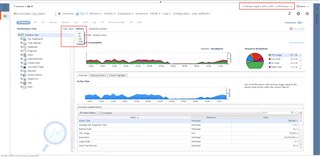
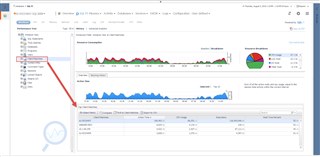
Expand the Instance View in the Performance Tree panel and select Client Machines. This lists all of the hosts that connected and ran at least 1 SQL within the selected time frame (subject to the "top x" parameter set earlier).
The Top Client Machines table then lists all of these sorted by Active Time. The other metrics in the table can be used to sort too. A comprehensive list of additional metrics can be added with the "Select Metric" option.
The table can be saved as a CSV file with the "Export to CSV" button. That was easy!
But wait, there's more.
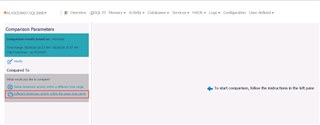
The Compare button can be used to check if a particular application server (client machine) has been doing roughly the same workload day in and day out. Or, a check can be made to compare AppServer-A vs. AppServer-B. Compare workload gives options for both use cases. The highlighted option in the screenshot below is for the latter.
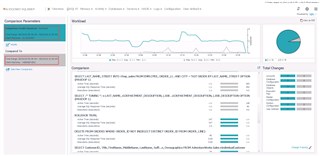
The workload from one machine is easily compared to the workload from another. Any dimension that has significant deviations is also shown, and expanding any of them provides deep details. In the screenshot, there is good evidence that SQL statements were running from 1 client machine, but not the other (the "n/a's").
If there is a need to go deeper, all of the PI data can be access via SQL. I've posted instructions here. Links to the PI schema reference are available within that post.
To learn more and to try Foglight Performance Investigator in your own environment, just go here.
