
In every SQL Server instance the TempDB database is the common global resource for all the operations taking place and DBA's are particularly cautious about the use of it. Given the nature of applications and ad-hoc queries by users, one must keep track of the usage of the TempDB by various applications and process and take appropriate actions when the size falls below a certain limit. To ensure optimal health of the TempDB, it must be monitored over time which will help determine what optimal size should be and address any performance degradation of workload utilizing it. Foglight for SQL Server contains a dashboard specifically geared for monitoring both TempDB space usage and current activity against it.
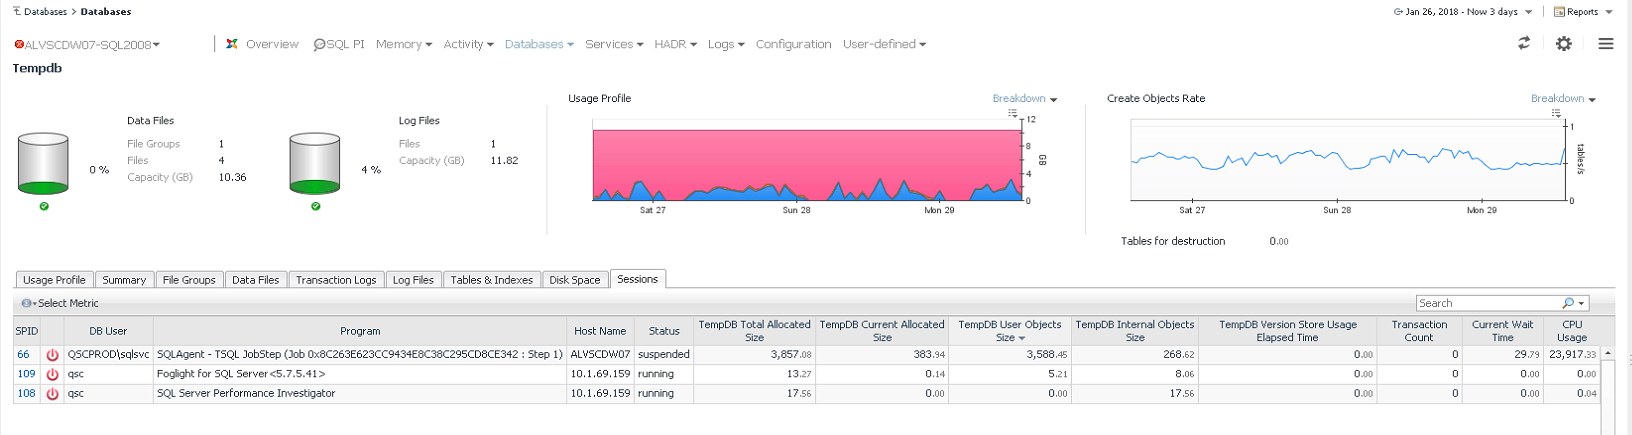
Fig. 1 - TempDB Dashboard in Foglight
At the top of the dashboard (see Fig. 1 above), indicators are in place that show the amount of space currently allocated across all datafiles used by the TempDB while the usage profile graph shows how much space is used by User/Internal Objects, Version Store or Unallocated Extents. There is also a graph which shows the rate at which objects are being created per second. Using the lower half of the dashboard allows the DBA much more insight into TempDB consumption including a tab for Usage Profile, File Groups, Data Files, Transaction Logs, Log Files, Tables/Indexes and Disk Space
The Sessions tab at bottom half of the dashboard shows SPIDs that are currently allocating space in the TempDB itself as well as the breakdown of size used by User/Internal Objects and Version Store; including additional metrics on transaction count, current wait time and CPU consumption. Although the TempDB Dashboard in Foglight is geared for showing current session activity, a DBA can use the Usage Profile graph at the top to see historical trends of consumption against the TempDB. Once a historical time range has been established, one can go to the SQL PI Dashboard (see Fig. 2 below) and focus on workload that has been executing against the TempDB to gain further insights into what may be causing performance degradation. A long running transaction may prevent cleanup of the transaction log thus utilizing all log space available causing a space problem for all other transactions using the TempDB.
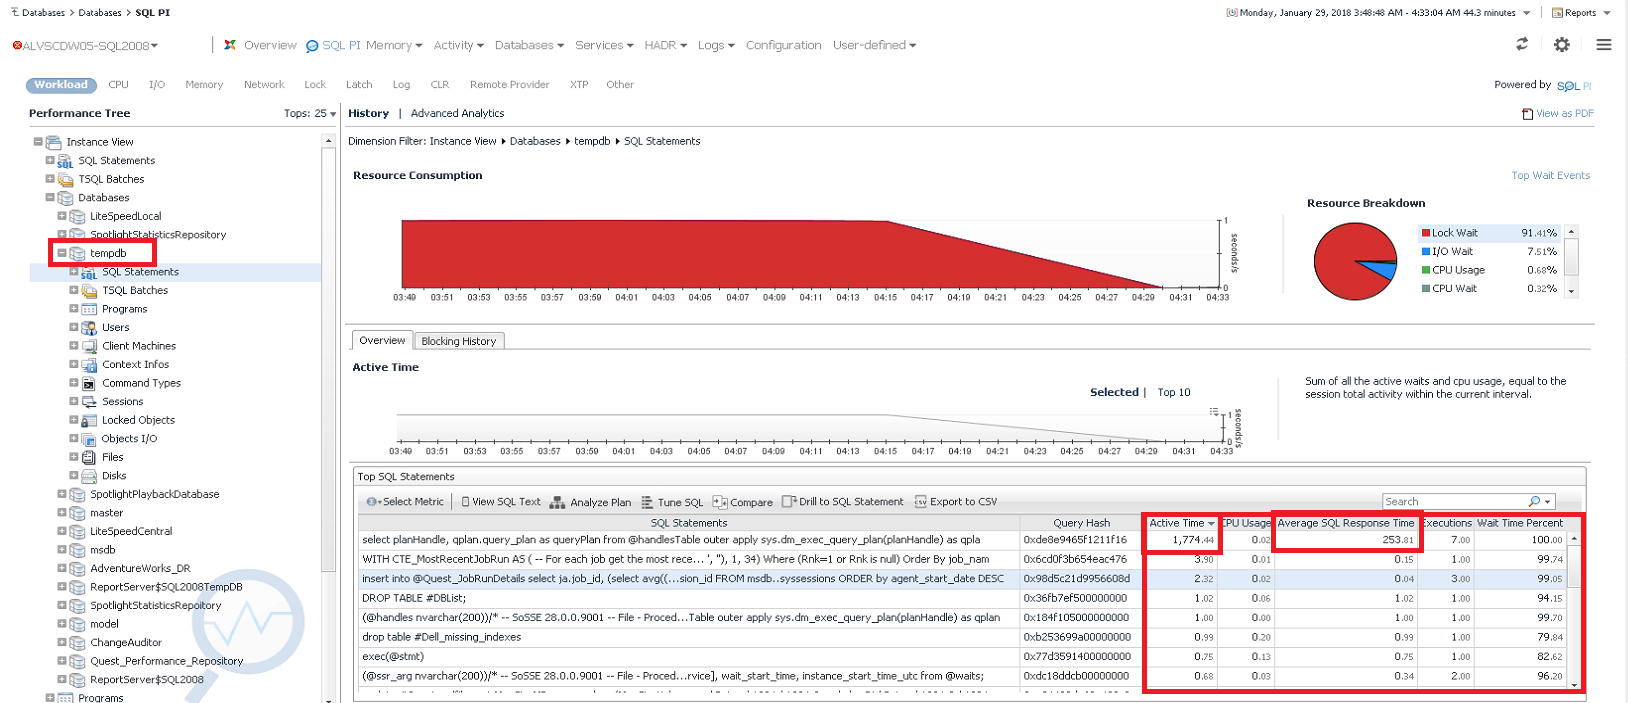
Fig 2 - SQL Performance Investigator with focus on TempDB during a historical time range
If you have ever had such requirements to monitor and troubleshoot TempDB in your environment, take a look at Foglight for SQL Server to save precious time in attaining the most important aspects of usage and activity for that very crucial database found in every SQL Server instance.
