
Many things can happen if the database runs out of disk space. None of them are good. DBAs understand that it is essential to monitor database disk space so that critical business processes are uninterrupted. Quest’s Foglight provides peace of mind by monitoring that space and alerting on the threshold well in advance of potential space issues.
(*As of Foglight v. 5.9.3.10), Postgres alarms can be found/configured/managed here:
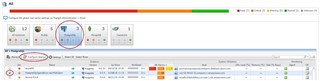
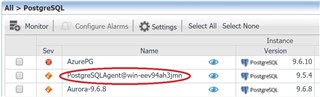
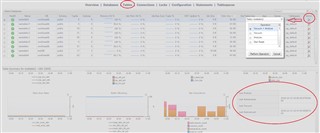
Navigate to the instance(s) you’d like to manage by checking the box(es) to the left of the instance name(s). With appropriate Foglight privileges, the ‘Configure Alarms’ button will be enabled. Select it.
(Click on the images to enlarge)
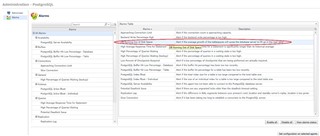
If the average calculated tablespace growth rate is going to use up the existing space on the hard drive within 15, 30, or 60 days (default), Foglight will fire the alarm.
Select the alarm from the list on the left side to view the alarm properties.
Select the ‘Edit’ link to modify these settings.
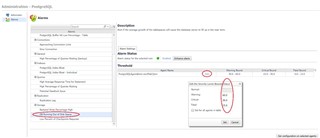
Note: This requires Host monitoring (via the Foglight Infrastructure cartridge) to be able to calculate disk space available.
Foglight provides Postgres Tablespace information.
Note: Tablespace information is not available for DBaaS cloud environments since the information is not managed by the user. Rather, it is managed by the service. (So, in this case, you shouldn’t run out of space anyway.)
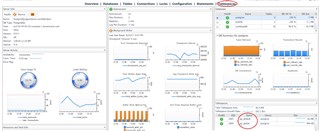
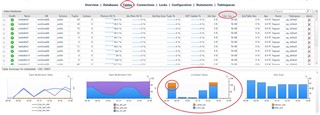
Back on the Foglight database home screen, click on the instance name to access the Overview page.
The tablespace data can be found in the lower right corner of the Overview page.
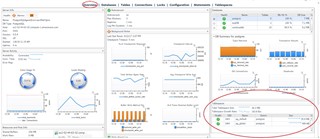
Here, you can see the tablespace OID, Name, Owner, and total tablespace size.
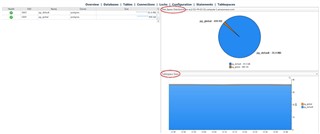
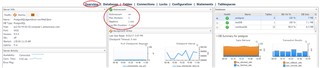
Select the tablespace name or select the Tablespaces page link at the top of the page to drill down to the Tablespaces page.
Additional information here includes the disk space distribution and the tablespace sizes over time.
To further diagnose space issues, first determine the databases and tables using the tablespaces. Then, make note of those databases’ and tables’ growth rate over time to help narrow down/determine which may be responsible for that increased tablespace growth. (Tablespaces can/often host multiple databases and tables.)
To do this, navigate to the Databases and Tables pages via the page links at the top. This example is for Databases. Navigation is similar for Tables.
Another possibility for unexpected growth is that the system has not been vacuumed in some time.
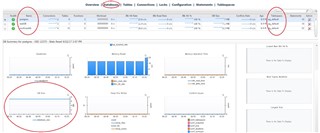
Navigate to the Tables page by selecting the Tables page link.
Look for large tables. Then, see if there is a high number dead tuples via the Live/Dead Tuples graph.
In Postgres, tuples are logical representations of rows. Rows/tuples are not actually removed when they are deleted. Rather, they are simply marked for deletion. These are considered ‘dead tuples’.
A ‘vacuum’ is an administrative process by which these dead tuples are cleared out to remove the ‘dead’ space from the file(s).
Foglight allows users to both view the current Postgres configuration of auto-vacuum (on the Overview page) as well as initiate a manual vacuum.
To perform a vacuum, select the ‘Admin’ icon on the far right side of the Tables (or Databases) page and select ‘Vacuum’. If an Auto Analyze has not been done and the structure has changed, consider choosing ‘Vacuum and Analyze’.
Additionally, you can look to see if the system was recently Auto-Vacuumed.
Note: The user must have Postgres Administrator privileges to perform these tasks.
For more information, visit Foglight database monitoring to download a free trial.
