
As a Sales Engineer for the Database Performance Monitoring team, one of the more rewarding aspects of my role is to learn about specific ways that our customers are leveraging Quest solutions. With that in mind, I am a firm believer that if something proves useful to one user or team, it's a good bet it'll be helpful to many other end-users as well. That, and my mom always reminded me to share. So, here we go...
While speaking with a customer - a DBA supporting an environment for a Property and Casualty Insurance company in the Midwest, he quickly opened up. It is not uncommon to engage with customers and provide a 'health check' of sorts...understand how they are using the solution, learn what they like, understand what questions they may have, and point out additional ways to address the issues they may face in their environment. On this particular day, we were having a conversation about Foglight Performance Investigator (PI). The dialog was nothing short of a well-timed tennis volley. In a fun way, it was similar to watching two spokespeople discussing a solution on an Infomercial. As we navigated Foglight PI's drilldowns, the DBA would share specifically how he used it and how it helped him. Knowing this would be 'gold', he noticed I was taking detailed notes about the use cases he was sharing. "No need for notes", he said. "I have all of this detailed in a 40+ page document." (yes, 40). He explained it read more like a 'How To' manual for team member reference.
With that long-winded introduction to set the stage now behind us, below are a few excerpts from that document. Specifically, it speaks to how they utilize three resource types in PI (Users, Sessions, and Network) Enjoy!
Users
A case where this view can be helpful is if a specific user is pulling very large amounts of data with a local report, as was the case with the below:
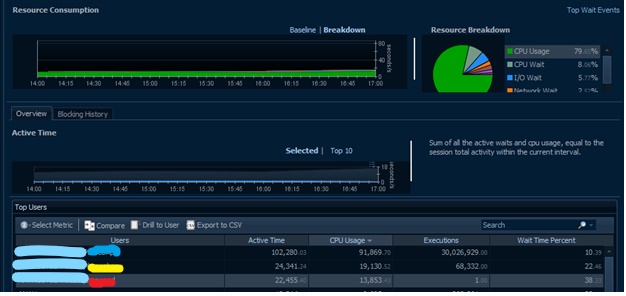
Looking at the above, we see overall User workload as compared to the individual red user’s machine in the Selected Queries. Noticing that a single user’s machine is listed as the third highest contributor behind the main Web App and Services logins, we get a good indication that there might be a heavy report running. Filtering to just this machine, we see it’s causing almost a 2s wait by itself for a single query along with significant network waits, which may indicate shoving a large quantity of data across the IP pipeline.
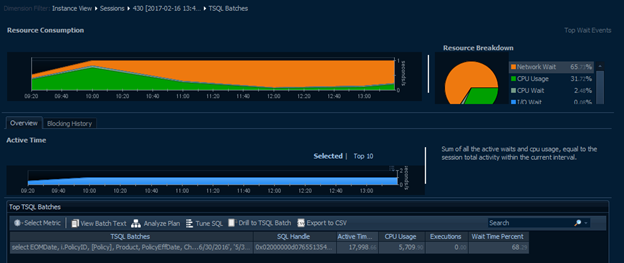
Sessions
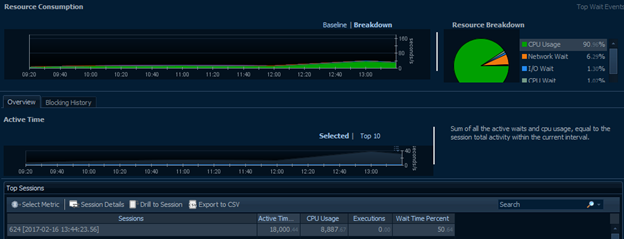
This section’s usefulness is similar to Client Machines in that we may need to find out if a very specific user is causing system-wide problems. In a similar vein, we’re not likely to see any single session contributing much to the overall load. When filtering to a single user, we typically expect to see a small sample of the overall.
Going back to the earlier example of roughly a billion reads, we see below that this user actually has two active sessions with the same query running. Additionally, no other single session is large enough to display anything in the blue Selected Queries graph while both of these show their own contributions. If a normal query or large report from a single user’s session were responsible for a significant portion of a busy server’s overall metrics as below, this should definitely be a red flag for further investigation.
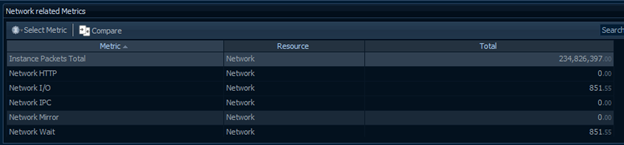
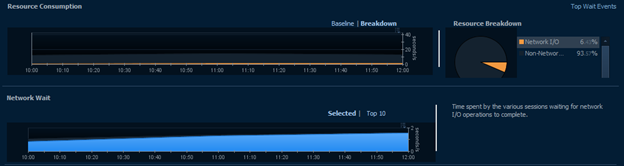
Network
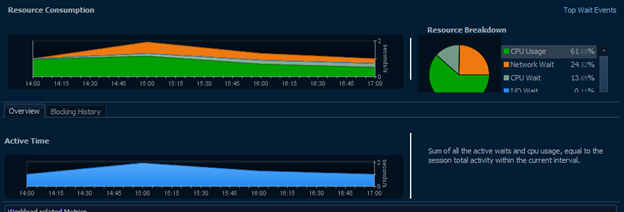
As discussed in several other sections, network usage can be one of the single most useful tabs for narrowing down where a bottleneck is occurring. It might be due to where a specific query is coming from, where a large portion of data is going, or it might point to an overall issue with an endpoint or the network as a whole and eliminate the SQL Server as a possible root cause.
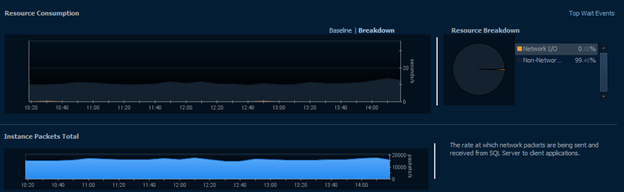
In this view, we’re able to see just how much wait the server is experiencing from the network and would also be able to track down which machines are causing or suffering from that wait. In the case of the above, we see very normal system usage during business hours. There are a fairly high, steady number of packets traversing the network with almost no wait times contributing to the system as a whole. In fact, there’s only a single, small instance of a wait between 12:40 and 13:00.
Generally, these waits will be caused by a single machine or user rather than specific queries. As a result, it can be more useful to investigate the Users and Client Machine tree views. In this case, it makes sense that XXX would have the highest network waits for XXX since PL heavily uses XXX for data retrieval and may use some intensive cross-server queries.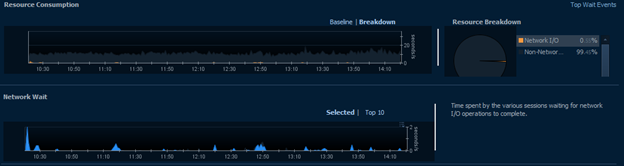

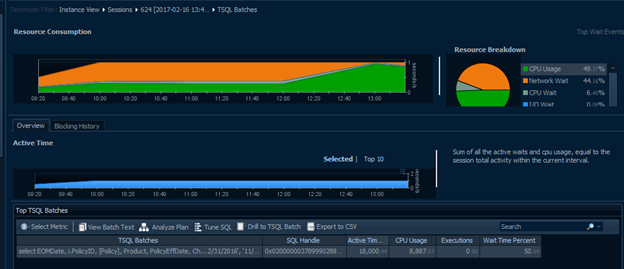
In the case of a much larger cross-server query or report, we might see something like the following. Again, it’s not causing significant wait times, but it is a single user’s machine skewing the entire system and causing roughly 2s waits across the network.
Visit Foglight database monitoring to download a free trial.
