
If you are at all like many of the other Foglight administrators I speak with on a regular basis, you've become the master of the out-of-the-box Foglight dashboards and reports. You can use Foglight to diagnose an issue in your virtual environment, no matter if it is happening now or in the past. You understand what performance counters are most important, where they are located, and what reports to run to get the information you need. You are a performance monitoring guru!
Unfortunately, the same can't be said for your users, VM-owners, or tenants. If they have access to Foglight's user interface, they may sometimes struggle to find the counters or charts that are most meaningful for their situation. If they don't have access to Foglight, it can be even worse -- they bug you for the data! "Hey %vmware_admin%, my application was slow yesterday. Can you get me a performance report?"
If there was only a way to quickly and easily generate a performance report for a virtual machine and have Foglight deliver it directly to the person who cares the most about the contents. Well, there is! In this blog post, we'll create a reusable dashboard and report that contains only the information your users want, and I'll share a method to quickly generate a report that emails it to your user.
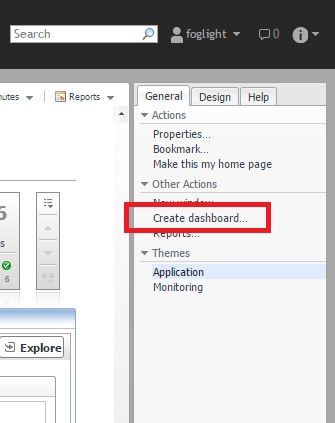
We'll start by creating a new dashboard. If you've never created a custom dashboard before, don't worry -- it is easy! Start by clicking the Create Dashboard link available on the action panel's General tab.
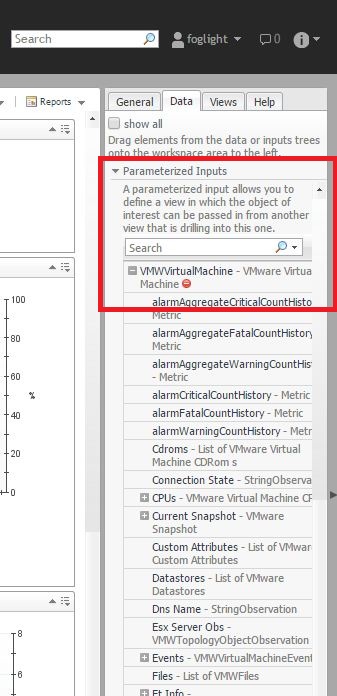
After completing the wizard, you'll be presented with a blank dashboard. Next, open the Data tab in the action panel. Here's where we'll leverage Foglight's parameterized input capability to make a dashboard that is reusable, and not built for one specific VM. Start by expanding Data > VMware > VMware Virtual Machines. Grab one VM (any VM will do) and drag its name straight up to the "Parameterized Inputs" section of the action panel. We've now told the dashboard to prompt us for an input parameter (VM name) every time it renders. Next, drag the counters you want from underneath the parameterized input (VMWVirtualMachine - VMware Virtual Machine) out on to the dashboard. I like to collapse the Data menu as a way to remind myself what counters to use.
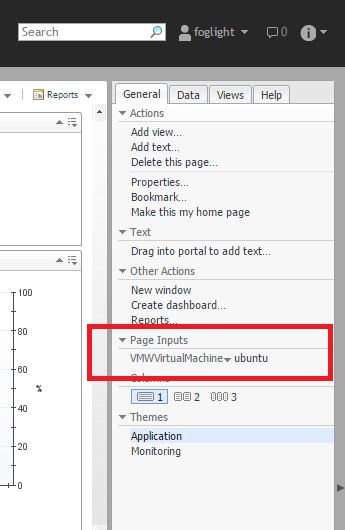
Once you have created a dashboard containing all the information you need, test out the re-usability factor by navigating back to the General tab and selecting a different VM within the Page Inputs section. You should see the dashboard change to display details about the selected VM. Note: Sometimes, the title of a graph may "lock in" on the name of a specific VM, but that's easy to change. Click the Options menu in the upper-right of the portlet, and select Edit Properties. You can change the graph/section title from there.
Next, we'll convert our dashboard into a report. Select Create a New Report from the Reports drop-down in the upper right corner of the screen. Select "Create a Report based on the current Dashboard", and then "Direct copy" in the report creation wizard. We now have a mechanism to, on-demand, generate a report for any given time frame and send it to the appropriate user(s).
Let's check out what that process looks like! From any Foglight dashboard, select the Reports drop-down in the upper right, and pick "Run a Report". On the All Templates tab, search for the name of the report we created above. Select a time range, as well as a VM for this report, and click Next. Give the report a name, select an output format, and enter the email recipients to send the report to.
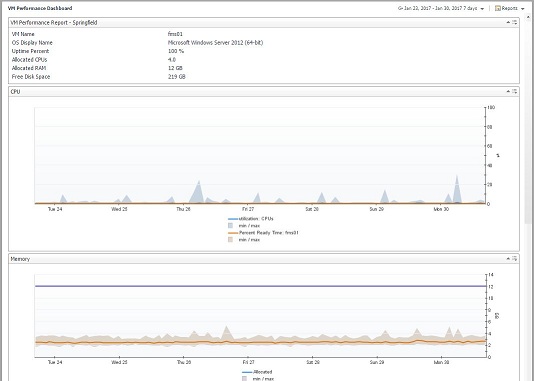
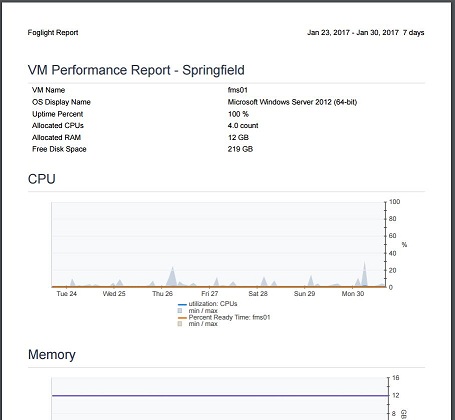
So, here's the final comparison of our new dashboard and report:
| Here is our Foglight dashboard ... | Here is our Foglight report ... |
 |
 |
That's it! In a few short steps, we've created a dashboard and report that can be reused across VMs, generated on-demand, and put important information in your user's hands without putting any additional burden on you, the %vmware_admin%!
