
This blog series discusses each of the ‘tabs’ that can be found on the Database Home page in Foglight for Oracle.
Part 1 of the blog covers Foglight’s monitoring for Oracle’s Data Guard.
In this Part 2 of the blog, Foglight monitoring for Oracle’s ASM is reviewed.
*(Click on the images to enlarge)
What is ASM?
ASM stands for Automatic Storage Management.
Oracle ASM is a file system and a volume manager for Oracle database files and supports both Instance Oracle Databases and Oracle Real Application Clusters (Oracle RAC) configurations. ASM uses disk groups to store the data files. These collections of disks are managed as a unit. The file contents of the disk groups are distributed evenly to provide uniform performance.
Monitor ASM with Foglight
Prerequisites:
Foglight for Oracle cartridge v. 5.7.1.1 or newer.
Foglight for Oracle ASM agent creation
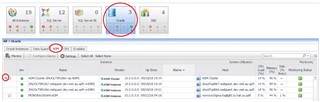
Choose the Oracle tile to isolate just Oracle instances registered and monitored with Foglight.
Choose the ASM tab.
This view will display and distinguish single ASM Instances or Clusters.
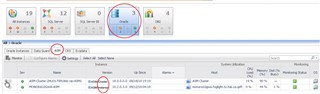
Expand the Cluster view to list related ASM Instance nodes.
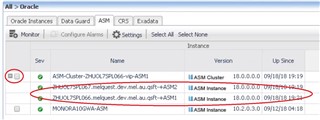
To navigate to the Summary dashboard, simply click on the Instance name.
Note a dropdown list available to access the Cluster or Node view.
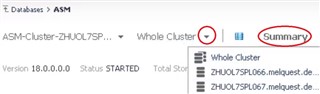
In the top left, note the primary information displayed including the Oracle version being monitored, its status, total storage, and the number of ASM (running) clients detected.
Select ‘ASM Clients’ to view a list of those clients and additional details.
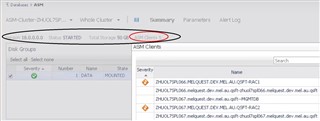
In the Disk Groups section of the dashboard, note the relevant information including state, size, usage, time, number (of disks), alarms, and an explore option.
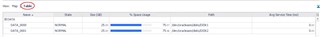
Below it, there are two View options, ‘Map’ or ‘Table’.
The details in these views is associated with what is selected in the Disk Groups table at the top (with options to Select All or None).
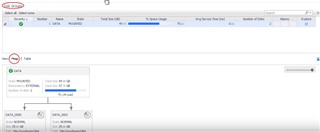
The information is displayed as a dependency mapping between the disk group and the associated disks.
Each item (group and disk) can be selected to display additional information.
For a selected Disk Group, a pop-up offers five tabs:
General: State, Redundancy, Number of Disks and Failed Groups, and Allocation Unit Size.
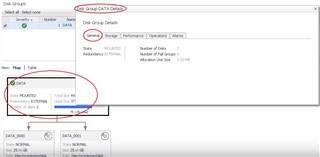
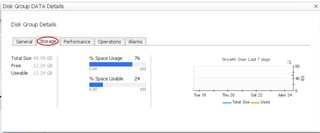
Storage: Total, Free, and Usable Size, Percentage Space Usage and Usable, and Trended Total and Used Growth
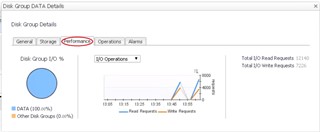
Performance: (Drop-down) – I/O Operations, Average Service Time, Disk Errors, Comparison I/O Load between selected and other disk groups
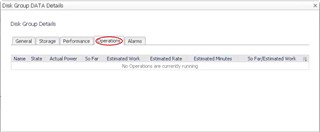
Operations: (Current/Running) re-balance operations state/rate
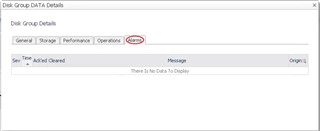
Alarms: Alarms associated with the disk group
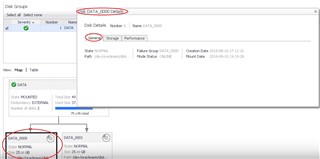
Similarly, there is a pop-up for Disk details with three tabs:
General: State, Path, Failure Group, Status, Creation and Mount Date
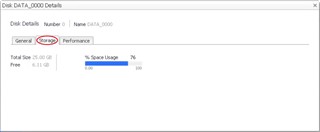
Storage: Total size, Free Space, and Percentage of Space Usage
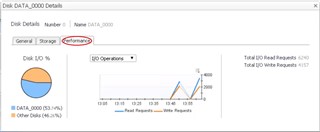
Performance: (Drop-down) – I/O Operations, Average Service Time, Disk Errors, Comparison I/O Load between selected and other disks
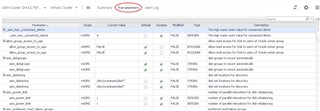
The Parameters dashboard displays ASM parameters information including the Parameter Name, Scope, Current Value, Default/Dynamic properties, Modified (T/F), Type, and Description.
The Alert Log dashboard (no data/alert entries in the example)
Messages are pulled from the Oracle Alert Log.

There is a match list that can be defined in the Global Administration settings.
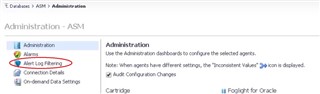
Select the Gear icon (far right). This opens the Administration dashboard.

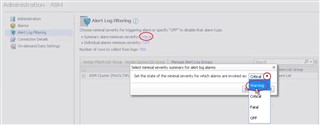
In the Administration dashboard, choose the Alert Log Filtering option in the tree on the left side.
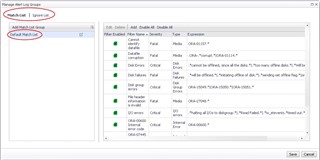
Alarms can be generated based on Oracle Alert Log messages using regular expressions.
There are Default Matching Expressions. Note that these lists are customizable.
Alarms:
Navigate and view ASM alarm options.
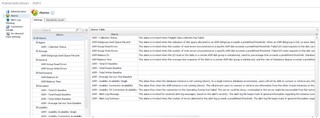
From the Database Home page, check the box to the left of the instance and choose the ‘Configure Alarms’ button above the Instance list.
This is the Alarms interface listing the associated ASM alarms available.
Sources for some of the content of this blog include Oracle's database Online Documentation Library as well as this Quest-created video -> https://www.youtube.com/watch?v=P-FEEOmVzNc
For more information, or to request a trial, visit the product page: Foglight database monitoring or Foglight for Oracle
