
Just the Facts!
Spotlight on SQL Server Enterprise was intended to give a visual display of what bottlenecks could be happening within your SQL Server Engine. The display is very intuitive and focused on where a bottleneck could be within the engine real-time. However not everybody wants to deal with that level of visualization, they “Just want the Facts” sort of a Joe Friday approach. That can be achieved very easily, so let’s change the look to present,” Just the facts”.
The fact is Spotlight on SQL Server provides many different ways to display what is happening in real-time. The display I am referring to is Spotlight Today. “Spotlight Today” is easily accessible from the Desktop client and I use it as a starting point with all new installs. This will allow me to identity issues associated with the “Factory Settings”. This is intended to make some informed decision as to what is a valid value, a need to adjust the provided value or even set the error to be ignored or navigate to a more detail display.
The fact is Spotlight on SQL Server does more than just monitor the SQL Server engine. It will monitor the Windows Operating system that the engine is installed, some virtualized metrics from VMware or HyperV and functional components of SQL Server such as Analysis Services, Replication and Always on Availability. If you have an Azure instance we can also include that as well. You will be able to manage all of these components in the same consistent manner.
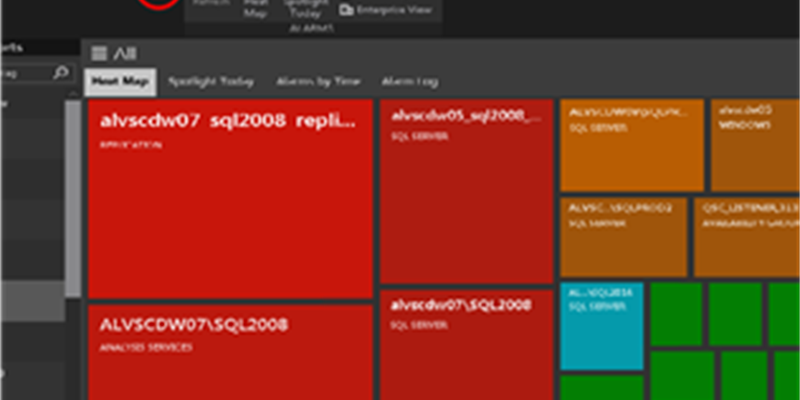
But let’s get back to setting the display in Spotlight Today. As you open the Desktop client for Spotlight for SQL Server you will be presented the Heat Map a visual of all monitored components in represented in a color code by level of severity.
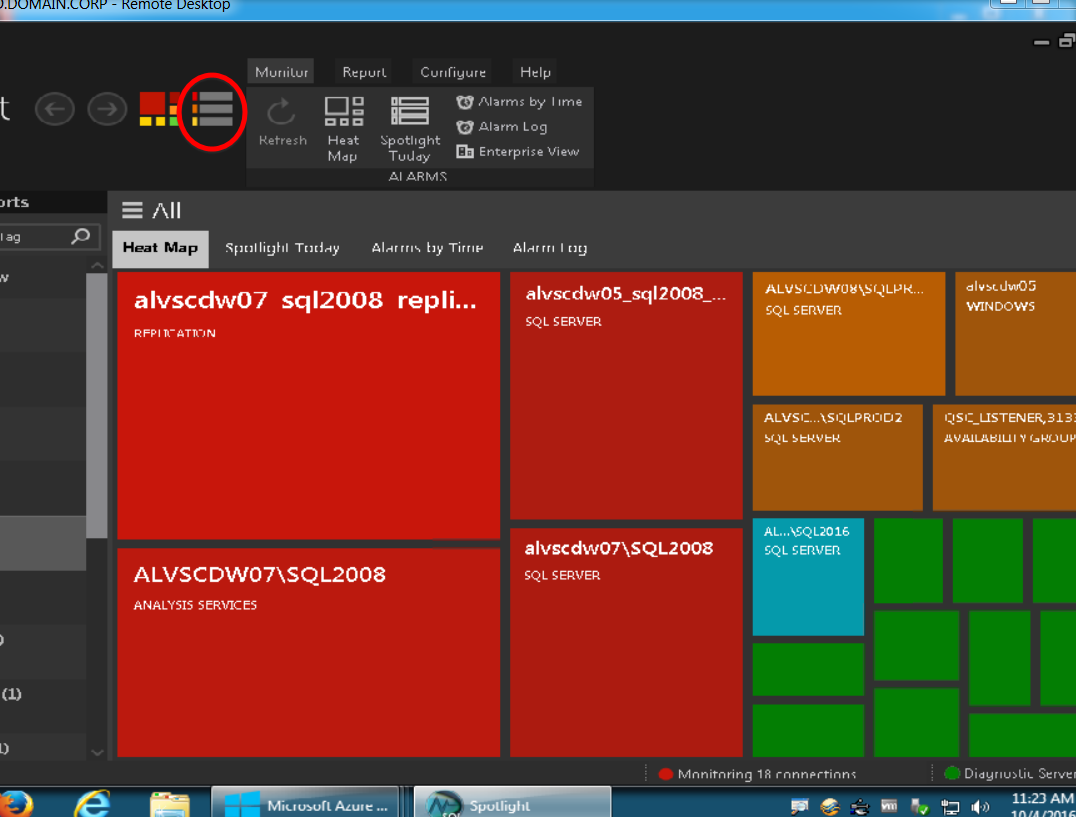
The fact is we can change this display quite easily. We just need to select the tab next to and above the “Heat Map”. The tab is labeled Spotlight Today or you could select the circled icon which represents “Spotlight Today.”
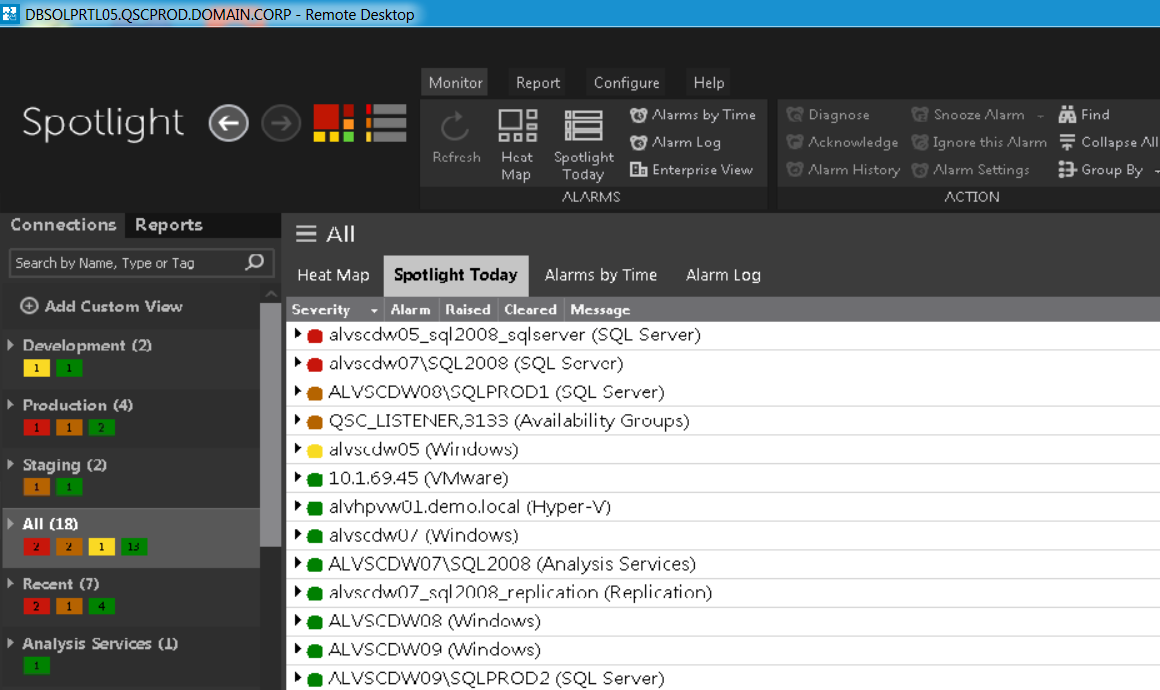
Once you enter this dashboard, the monitored elements are listed by “order of severity.” I am going to filter out the element list and change the display to the type of errors detected. This can be accomplished by changing the grouping order.
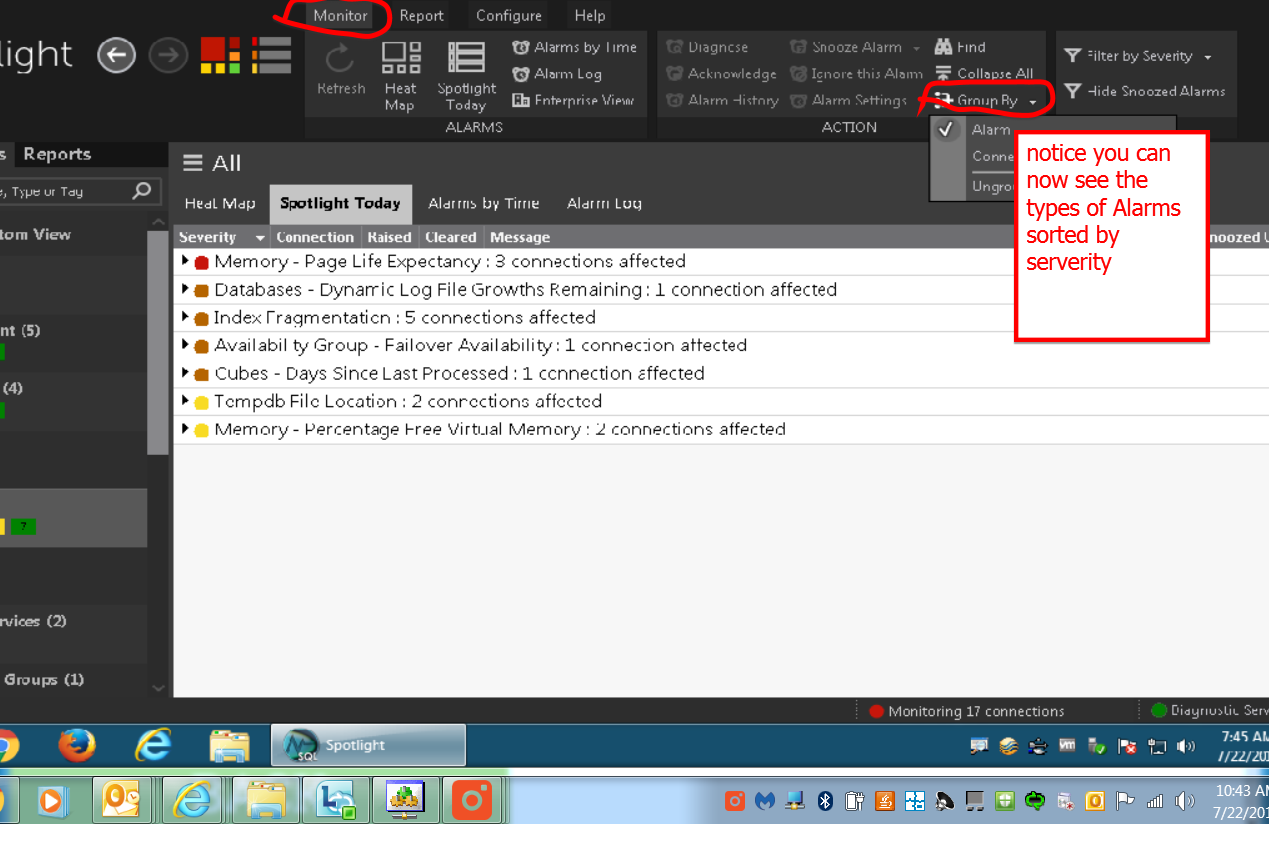
The fact is the result of that change will provide you with a list of errors detect based on the alarm setting.
Now, we have the Facts of what Spotlight for SQL Server has detected. Armed with the facts we can now start to make informed decisions on how you want to handle or further investigate any of the generated alarms. This is the first of a series of “Just the facts.” I will follow with where I can go from here with this display. Stay tuned as I will provide you the how to acknowledge, diagnose, ignore, and snooze alarms from this display.
