Over time, as more and more applications introduce more and more databases into your company, your data becomes siloed and getting accurate information becomes challenging.
The popular answer to this challenge has been the introduction of data warehousing – where data from several different applications gets replicated into a single repository. This certainly ticks the box and overcomes the challenge but introduces a new set of issues.
Firstly, it’s costly to setup and maintain the data warehouse and the replication streams that feed it. And for smaller companies the cost and expertise required simply puts data warehouses out of reach. Astera Software published a blog in 2021 that estimated the average cost of a data warehouse (factoring in storage costs, ETL tools, HR costs, training, electricity, etc.) comes to about $360,000 - $372,000 per year.
www.astera.com/type/blog/building-a-data-warehouse-cost-estimation
Secondly, the data in data warehouses is not used efficiently. Information is being generated and replicated into a data warehouse faster than it can be consumed. According to Forrester Research, 60-70% of all enterprise data goes unused.
Thirdly, data in a data warehouse is often out of date: replication streams occur on differing schedules - some may be near real-time while others could be as infrequent as 24-hour intervals. This leads to less confidence in the data, incorrect decision-making due to outdated information and will ultimately stifle innovation in your company’s data analytics as people move away from using the data warehouse.
So, what is the alternative?
Well, what if you could access the data that you want directly from its original application when you need it?
Let me introduce Toad Data Point – a single tool that enables you to connect to any data source in your company and create datasets by combining data from multiple data sources in real-time.
In the example below, I’m getting customer information from my CRM system and combining it with sales data from my Point-Of-Sale system.
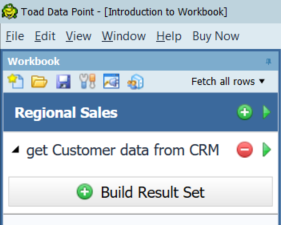
Using Toad Data Point Workbook, I first create a Regional Sales Workbook and start with a Workflow to get Customer data from CRM system:
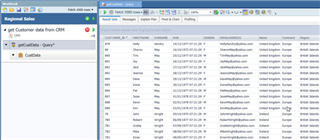
I get the data I need from the CRM system, using a simple “drag and drop” query builder and store that data for further processing:
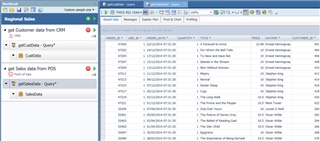
Next, I create a new Workflow within the Workbook that generates a sales dataset based on data from my Point-Of-Sale database and store that for further processing:
Now, with a third Workflow, I can combine the results of both previous datasets into a single dataset, using the customers’ unique identifier as the link between the 2 datasets:
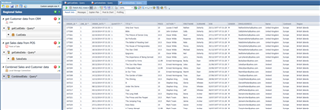
Before finishing I want to cleanse the data to make it easier to read and understand. In the below example I have split the Order Date, which contained the date and time in one field, into 2 separate columns – Order Date and Order Time - this makes it more flexible for further analysis where I may want to generate sales reports based on certain days and/or certain times of the day.
I used a built-in function to give me the day of the week that each Order Date was, and I added a Total column by multiplying the Quantity and Price.

Now that my data is cleaned-up, I’m going to create a couple of pivot grids and export them to Excel:
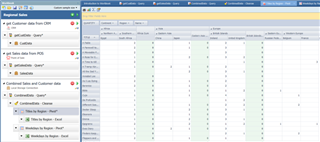
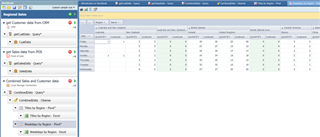
Now that I have the Workbook setup, I can manually execute the entire Workbook, or individual Workflows, when I want to and schedule it to run at specific times. Each time it runs it queries the data sources, so I know the data is always up to date.
As a result, I can now access and combine real-time data from all my separate applications, without the need for a data warehouse. I’ve done so using the “drag-and-drop” query builder, so I didn’t have to write a single line of SQL code and I have a very easily reproduceable process that gives consistent results.
To learn more about Toad Data Point and trial it out for yourself, go to: www.quest.com/products/toad-data-point


