

One of the challenges of creating a new report or dashboard is finding the data you need. The way data is stored in a database doesn’t reflect how it will be presented in a report/dashboard.
Toad Data Point can assist in identifying what data is stored in which tables and how they all “tie together”, helping you understand the data structure so you can build a dataset with the confidence that you have all the data you require.
When you connect to a data source in Toad, you will probably have access to a lot more tables than you require, and it can be hard to see the wood from the trees.
The first thing I recommend is finding one table that you know you need. It may sound over simplistic – but you have to start somewhere.
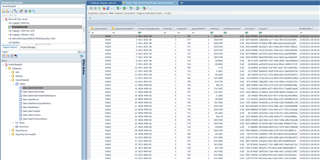
In the example below, I’m creating a regional sales report so I’m going to start by looking for “sales” tables in the Point of Sale database. To do so, I connect to my Point of Sales database, then in the Object Explorer, type *sales*. This tells Toad to show all tables with sales in the name:
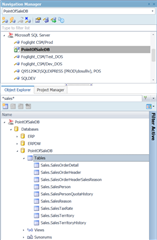
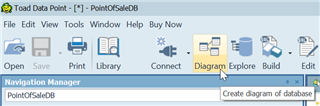
The table SalesOrderHeader seems like a good starting point. I’m going to create a Database Diagram within Toad and add that table to it:
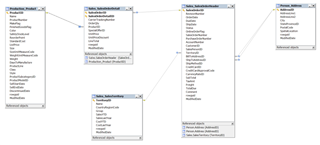
When I drag & drop the table into the diagram Toad will also bring across any other tables that reference or are referenced by the table I added. This is a very important and useful feature, as it shows me what other tables I’ll likely need to use when creating my sales report.
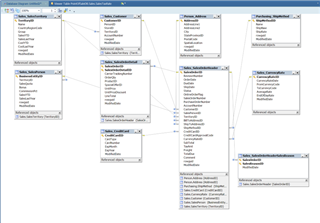
Looking at the tables and columns, it appears all the data I need is listed in the tables, but I’m now going to investigate these tables in more detail using the Database Explorer.
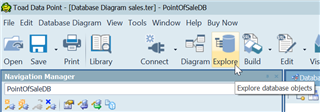
The Database Explorer allows me to view the column datatypes and the actual data within the tables. I select the table from the left-side panel and the right of the screen will update accordingly:
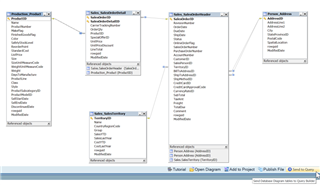
I’m confident that almost all the data I need is within the selected tables, but I need to add product information so I’m going to find the Product table and add it into the diagram also. At this point I know some of the tables on the diagram aren’t needed, so I can go ahead and remove them also before proceeding:
Now I have all my data and it’s time to start building the dataset. To do so I click the Send to Query button:
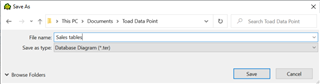
At this point, I recommend saving the Database Diagram. The likelihood is that you’ll be creating new sales reports in the future using a similar dataset – so this will act as a very useful starting point. Click Save and this will pop up the save dialog box. Toad Data Point has its own specific extension (.ter) for Toad Database Diagram files.
Now you have a data model that you can reference and use as a starting point for future reporting.
For more information on Toad Data Point, check out the product page: