
We've all been there, the dreaded ticket that comes across our inbox. Always light on detail, just a single sentence: "The database server is slow." No five words bring as much fear, uncertainty and doubt to a DBA than those (well, maybe "The database server is down"). Armed with no information other than those five words, this blog post will serve to present a workflow that a DBA can follow using Foglight for Databases to determine first "if" a database server is slow, and if so, what may be causing the problem.
Step 1: Information Gathering
The first step in looking into a "slow" database server, is to try and quantify what "slow" means. The more information/context you can gather about the perceived problem, the more focused your diagnostic efforts can be. Questions I like to ask (if it's even possible to ask) are:
- What in particular is slow? Are you trying to run a query? Are you running a report that is taking too long? Is there a particular application/transaction that is timing out?
- Assuming you can find out what is slow, ask if the user can quantify the slowness. Is the query/report/application/transaction taking more than 30 seconds? Is it timing out?
- Gather a time "context". When was this query/report/application/transaction slow? Is it slow right now, was it slow a few minutes/hours ago? Is it slower than it was yesterday/last week?
- Does this slowness seem to only impact one query/report/application/transaction, or does everything you try to do seem to run slow?
I'm sure there are other questions you can ask, but this information gathering step is absolutely critical so that you can focus in on the problem, rather than having to take an extremely broad look at performance.
Step 2: Investigate Alarms
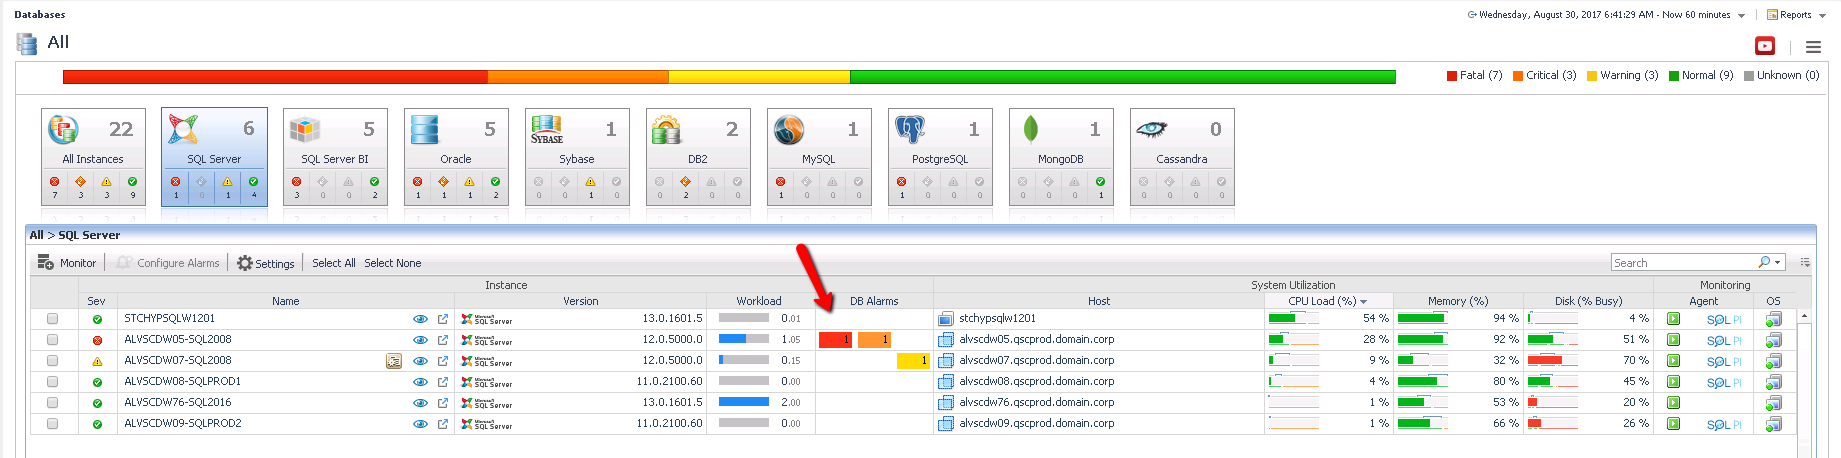
Ideally, if you have invested either time, or money into a monitoring solution, it will have raised an alarm that should indicate that there may be a problem. The specific alarm that has been raised, should provide some context into what exactly may be occurring. From the Foglight Global Databases dashboard, you can view alarms across all servers, and click on any alarm for more details:
There are dozens of alarms that may help point you in the right direction. Some examples of alarms to look for:
- High resource utilization (i.e. CPU %, Page Life Expectancy, Page Splits, etc...)
- Blocking and/or Deadlocked transactions
- High wait events, specifically baseline deviation alarms indicating that some wait event is occurring more often than normal.
Knowing which alarms are active, should help you focus your diagnostics into a particular drilldown, versus having to take a broader look at performance. Whether or not any relevant alarms have raised however, you can still follow the rest of the workflow presented.
Step 3: Look for Smoking Guns
There are a handful of issues that I often look for as potentially obvious causes of a performance issue. If I see one of the issues below, I can be fairly confident not only that I know exactly where to look to diagnose the problem, but also that my diagnostics will be successful. I've listed some "smoking gun" issues below, with my next steps for diagnostics:
- CPU utilization in the high 90%'s (or pegged at 100%).
- Verify that the CPU consumption is coming from SQL Server, and if so, look for top CPU consuming queries.
- If CPU is not coming from SQL Server, view the top CPU consuming windows processes.
- Long running blocking locks, and/or deadlocked transactions.
- Look at the longest running blocking scenarios and/or deadlock events. If the lead blocker in a blocking scenario is less critical than the user waiting on the block, kill the lead blocker. Look long term for tuning options that can prevent future blocks.
- Cluster or Always On failover events. Failovers cause certain queries/workloads to have to reload into cache.
- Performance problems caused by these events are usually short lived, however it would be helpful to understand why the failover occurred.
- VMWare causing resource overhead on your monitored database servers.
- Confirm that VMWare is in fact the problem, and if so, engage with your sysadmin team to understand how to better manage capacity.
- SQL Agent Jobs that have failed. Failed SQL Agent jobs may not lead to performance problems, however if the jobs in question were involved in data archiving/purging, failures of those jobs could lead to queries having to analyze more data than is typical. Also, if database maintenance jobs such as statistics updates and/or fragmentation management, poor performance could occur.
- Look at which jobs have failed, and why, and consider whether you can re-run them to get the system stable again.
- Critical error log entries. The SQL Error Log, while often overly chatty, can show important "red flags" that may cause performance problems. IO Failures and/or timeout events are often logged into the Error Log and are helpful for diagnostics.
- Look into which error log entries have fired, and follow appropriate diagnostics to determine why.
- There are several others. I'd love to hear in the comments any "smoking guns" that you feel are easily found on your systems!
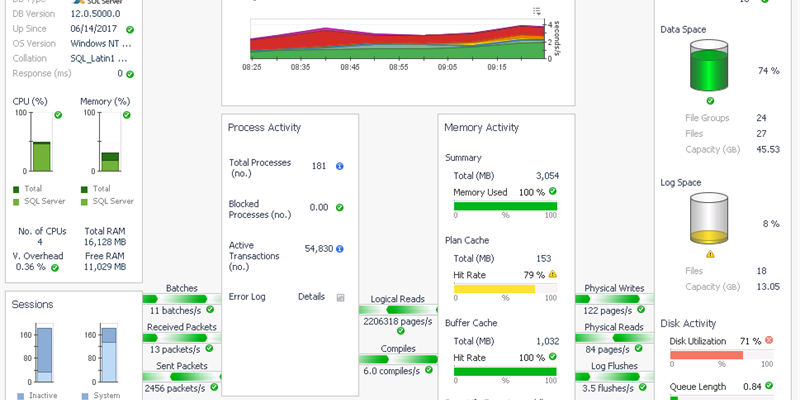
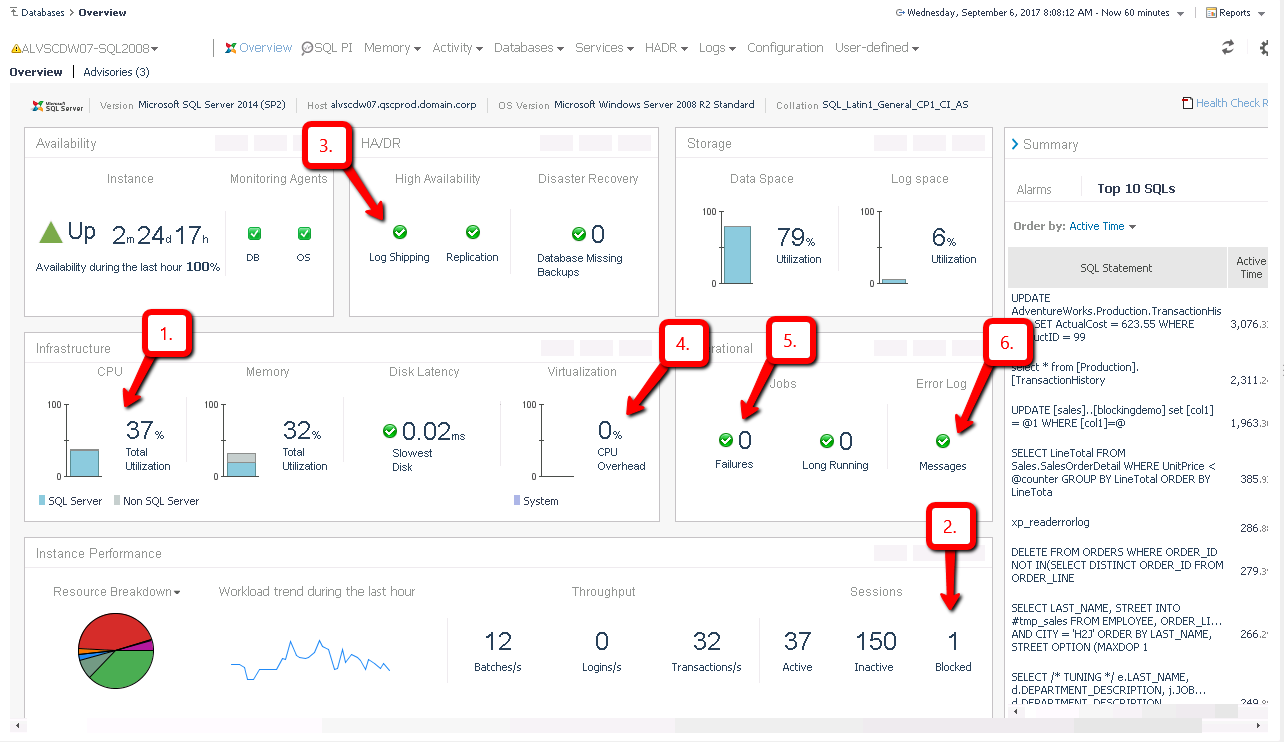
As you can see, this list of "obvious" issues can be lengthy. Looking one at a time through this list on a system that you are investigating can be tedious and time consuming. Foglight for Databases provides an "overview" page of each database server that can provide much of the information above in an easy to view single page. A DBA should be able to quickly glance at the overview screen, and understand whether any of the above "smoking guns" are present, and if so, launch into a very specific diagnostics exercise. The screenshot below overlays the six "smoking guns" above so you know exactly where to look:
Step 4: What if There Aren't Any Smoking Guns
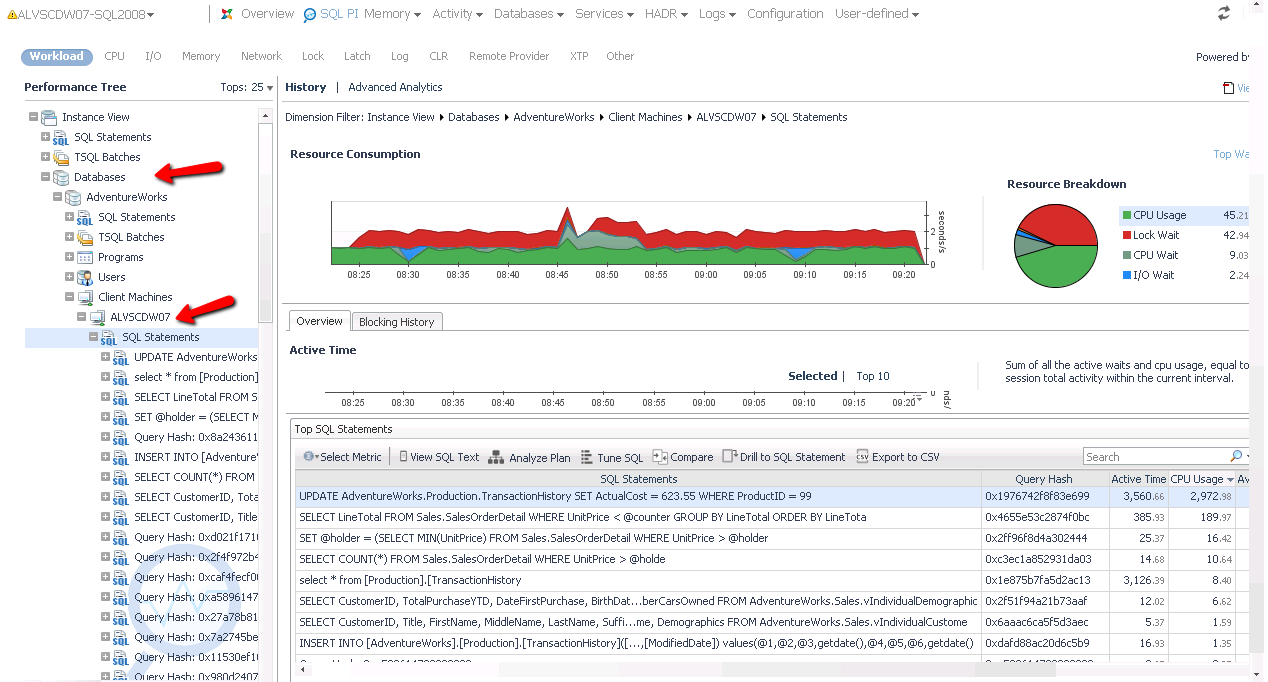
What if there aren't any obvious causes of "slowness". Don't fret, but the job will be a bit harder. With no "easy" problem, it's time to roll up our sleeves, and start digging into query performance so that we can start to understand what queries are running, how they are running, and why they are running that way. Each database platform provides its own mechanism for understanding query performance, however Foglight makes this task simple with its "Performance Investigator (PI)" drilldowns. The Performance Investigator drilldown allows a DBA to focus in on any time range, and understand what queries, users, databases, programs, machines, etc... are consuming resources. Through multiple levels of dimensional analysis, a DBA can understand (for example) that one out of 25 databases is consuming 90% of the active time. Inside of that database, they may figure out that 1 out of 3 application servers are generating 90% of the activity against that database. Finally, from that application server, they may discover that one user is executing a query that is averaging 2 minutes of response time where it usually takes 15 seconds. This individual query may not have generated a "smoking gun" condition, but assuming it's performance is critical to the performance of the application will help a DBA zero in on the root cause of the "slowness". From here, the customer could dig deeper into any change events that might have caused the query performance to degrade, or perhaps look into tuning opportunities to rewrite the query or modify indexes that might help. I've included a screenshot of the Performance Investigator drilldown below, showing "multi-dimension analysis" into query performance, however the screenshot does not do it justice. For a broader look at the features of the Performance Investigator drilldown, please watch the videos recorded by one of Foglight's product managers, Pini Dibask.
- Part 1 (Solving the Mysteries of SQL Server and Oracle Database Performance Problems) - https://youtu.be/HsEBbgpVHOI
- Part 2 (Hire a PI to solve the mystery behind execution plan changes) - https://youtu.be/stq250JNkgs
- Part 3 (Hire a PI to solve blocking locks mysteries)- https://youtu.be/FP6Djhyp0Lg
I hope this has been helpful. If anyone has any comments, I'd love to hear them!
