
In part one of this blog series, I discussed the history of Performance Analysis and its transformation into Performance Investigator, as well as the architectural differences between the platforms. In part two, we will discuss the new and enhanced features that come with Performance Investigator. All along, our goal in this transition was to maintain the feature set that customers have loved for years with Performance Analysis, and as you’ll see below, we feel we have done that while adding new valuable functionality to an already impressive feature set.
Features of Performance Investigator:
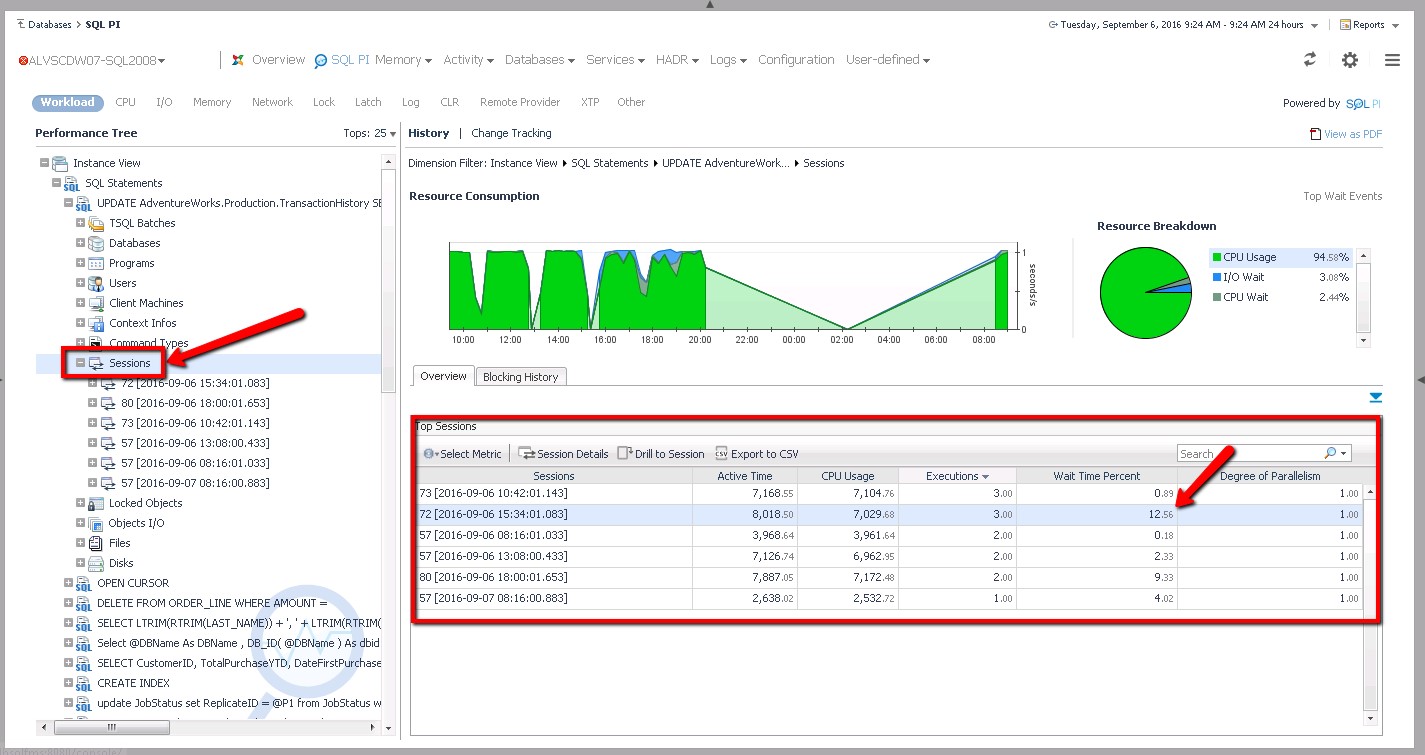
- Adding Sessions as a historical dimension: In Performance Analysis, Top Sessions (SPID/SID) were only available for the past one hour, and were presented in a flat list. While this was helpful, customers struggled with this limitation when diagnosing problems which occurred over an hour ago. This problem was especially apparent, when all database connections come from the same login, from the same set of application servers, and using the same program. In that case, all queries are lumped into the same dimensions, and it was difficult, if not impossible, to differentiate different threads of execution. In Performance Investigator, Sessions now appear as a proper dimension. The Top Sessions, and their associated queries, are now stored for a full week, allowing for much longer term analysis than previously possible. Also, Top Sessions are now available as a sub-dimension, allowing a user to break down an individual queries performance by each of the sessions that executed it. For queries that are run by lots of user sessions, this can be very helpful for isolating how a query performed by each session that executed it. Perhaps a query ran great by 9 of the 10 sessions that executed it, but one session experienced poor performance. This could point to a parameter sniffing problem, or a problem with how that 10th session executed the query, versus a global issue across all executions. In the screenshot below, you can see the UPDATE statement was run by six different session ID’s, some of which experienced a higher Wait Time Percent than others.
- Enhancements to Change Tracking: Change Tracking has long standing been a very powerful feature of Performance Analysis, allowing DBA’s to understand what is changing on a database server, and how that change has, or has not, impacted database performance. For SQL Server and Oracle, server configuration changes (cpu, memory, disks, network cards, etc…), instance configuration changes (sp_configure for SQL Server and init.ora for SQL Server), object schema changes (to tables, indexes, views, stored procedures, etc…), and execution plan changes are captured. In Performance Investigator for SQL Server, changes to accounts (logins that are added and removed, as well as server role membership) are now tracked. Also new in Performance Investigator for SQL Server is the ability to track which user made the change. The screenshot below, shows that changes were detected on a monitored instance, and as you can see the change event is placed on top of the workload graph to help determine whether or not the change had an impact on performance. Read a more detailed discussion of Change Tracking written by my colleague Amit Parikh.
![]()
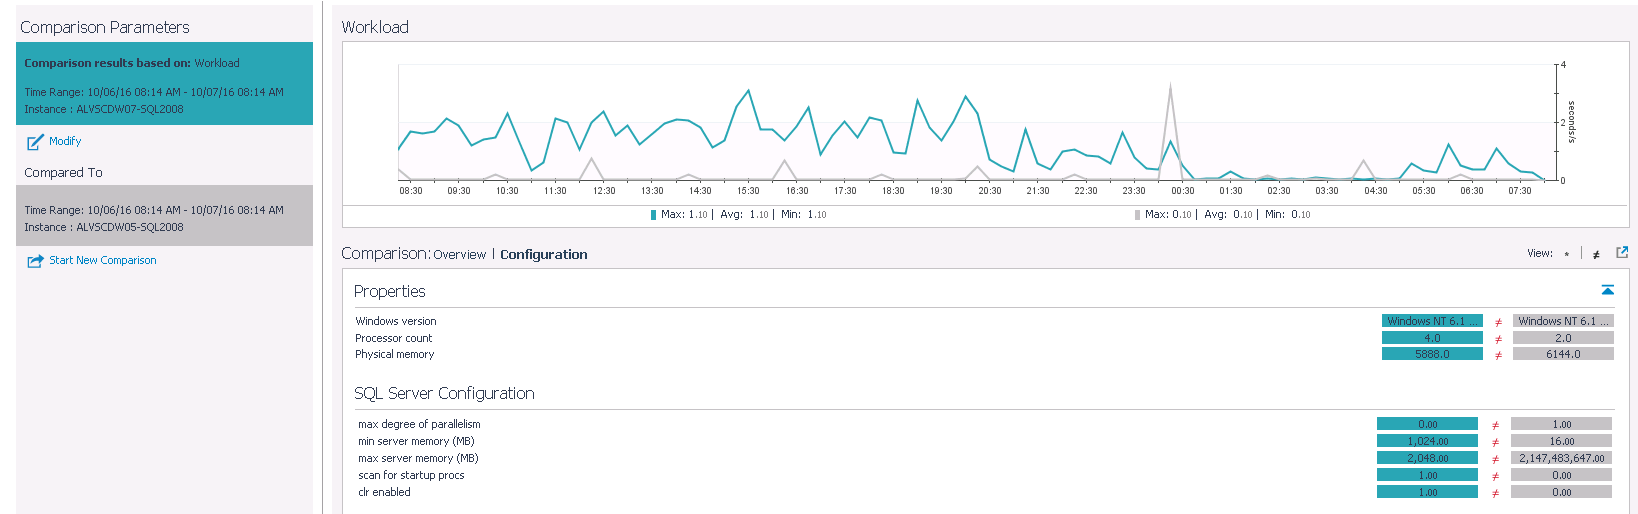
- Enhancements to Compare Reporting: Performance Analysis has long had the capability to compare a particular instance of Oracle or SQL Server over different time ranges. This is very helpful when trying to determine whether the instance was performing differently today, versus yesterday (as an example, many time ranges are available for comparison), and if it was performing differently, what caused the issue. Performance Investigator inherits this capability, however also adds the ability to compare two different instances of SQL Server or Oracle. This is very valuable when you may need to understand why a development and production server are experiencing differences in performance, or perhaps why two nodes of a RAC cluster (Oracle) or Always On Availability Group (SQL Server) are behaving differently. The output of this “cross instance” comparison will highlight key differences in resource utilization, i.e. server 1 is using 2x as much CPU as server 2, as well as differences in configuration between the two instances. Perhaps the non production server has a different “cost threshold for parallelism configuration” (SQL Server), or a different SGA size (Oracle), which would explain the difference in performance. Below you can see a screenshot of this cross instance comparison, highlighting configuration differences:
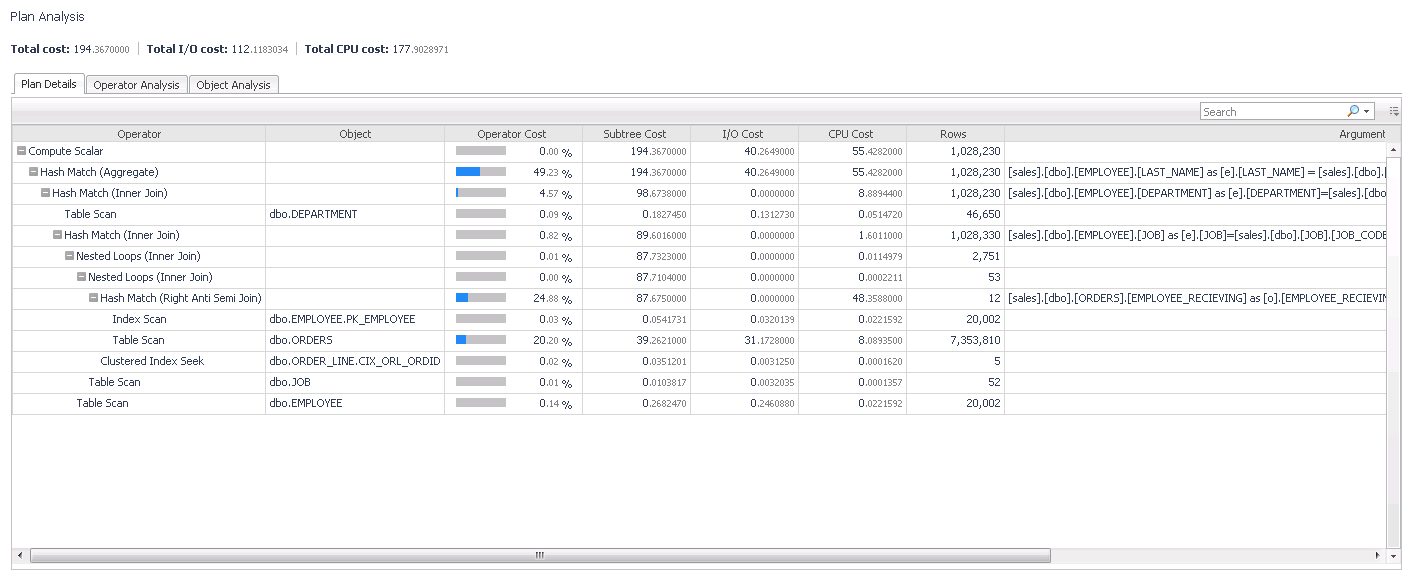
- Execution Plan Analysis: Brand new in Performance Investigator for SQL Server and Oracle is a feature that allows you to perform deep investigation of query execution plans. Performance Investigator will capture the execution plans used by the top SQL Statements that execute on a database instance, and store them in its repository for historical analysis. When you view the execution plan of a query, Performance Investigator will indicate aggregated cost metrics, broken down by plan, cpu, and IO cost, and aggregated by operation and object (table/index). Also, Performance Investigator will show plans that a query has used in the past. Perhaps a query was running great a few weeks ago, and is running terribly today, and it happened to use a different plan back when it was running well. Performance Investigator will allow you to view the historical execution plan, and even compare it side by side with any other plan to highlight the differences. Below you will see screenshots of the Plan Analysis interface, along with the interface that allows for execution plan comparison:
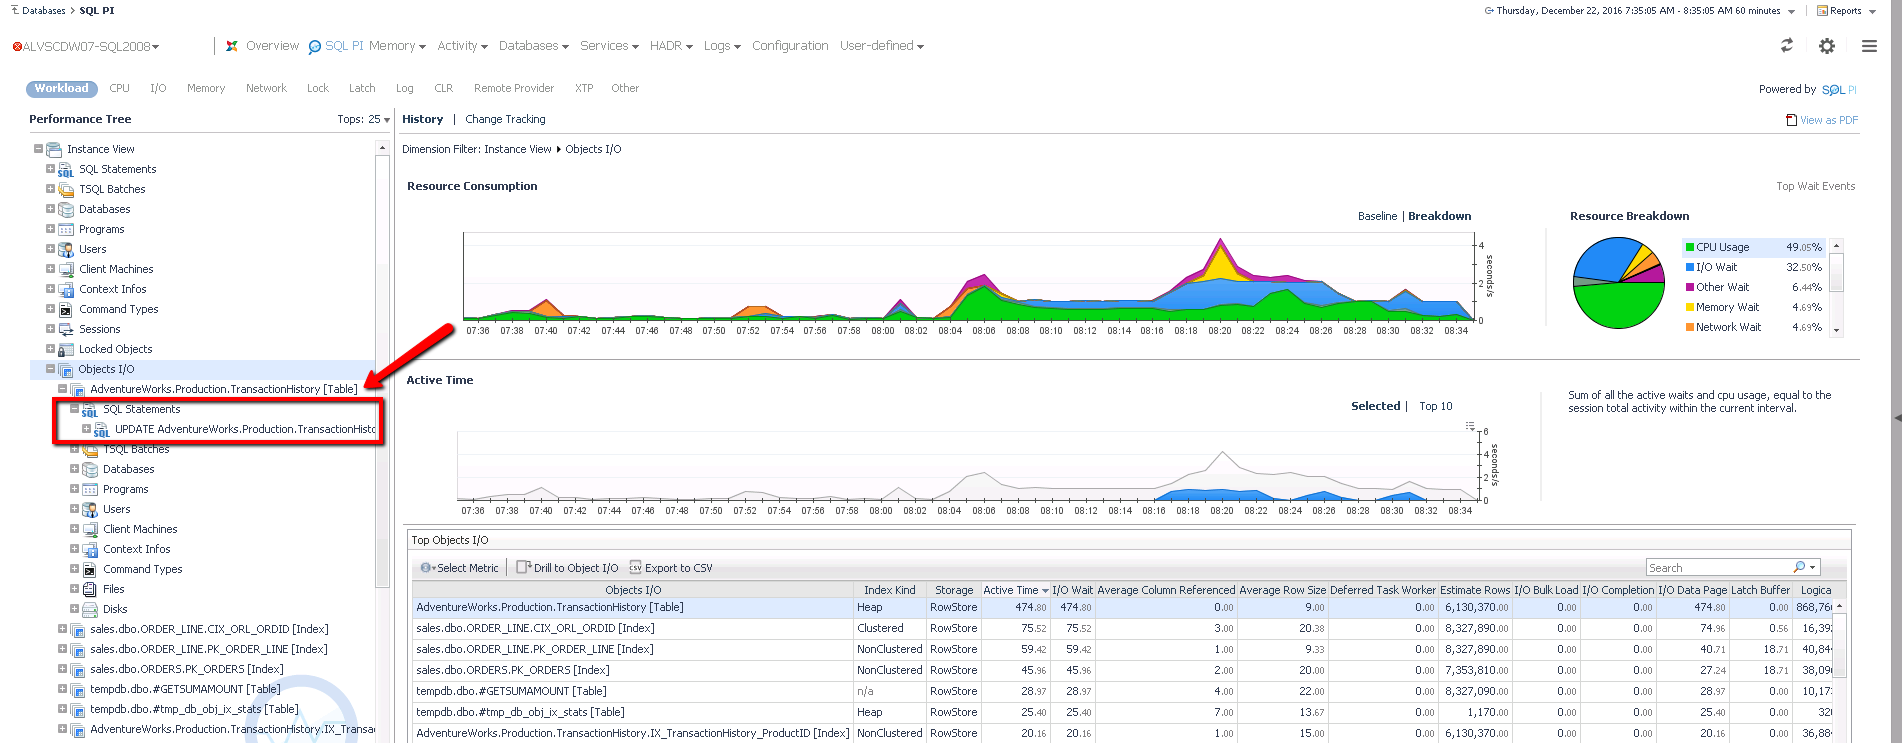
- SQL Server IO Analysis: Performance Analysis for Oracle has had an IO Analysis feature for a few releases now, allowing DBA’s to understand IO utilization broken down by Object, File, and/or Disk. This powerful feature is now also available to SQL Server DBA’s in Performance Investigator. For situations where you notice excessive IO utilization, and want to understand which objects (tables or indexes), files (data or log files), and/or disks are consuming IO, followed by the applications, users, and SQL queries that are consuming those resources, this feature is extremely valuable. In the screenshot below that we can determine that the AdventureWorks.Production.TransactionHistory table is our most IO intensive, followed by an UPDATE statement that is accessing that table.
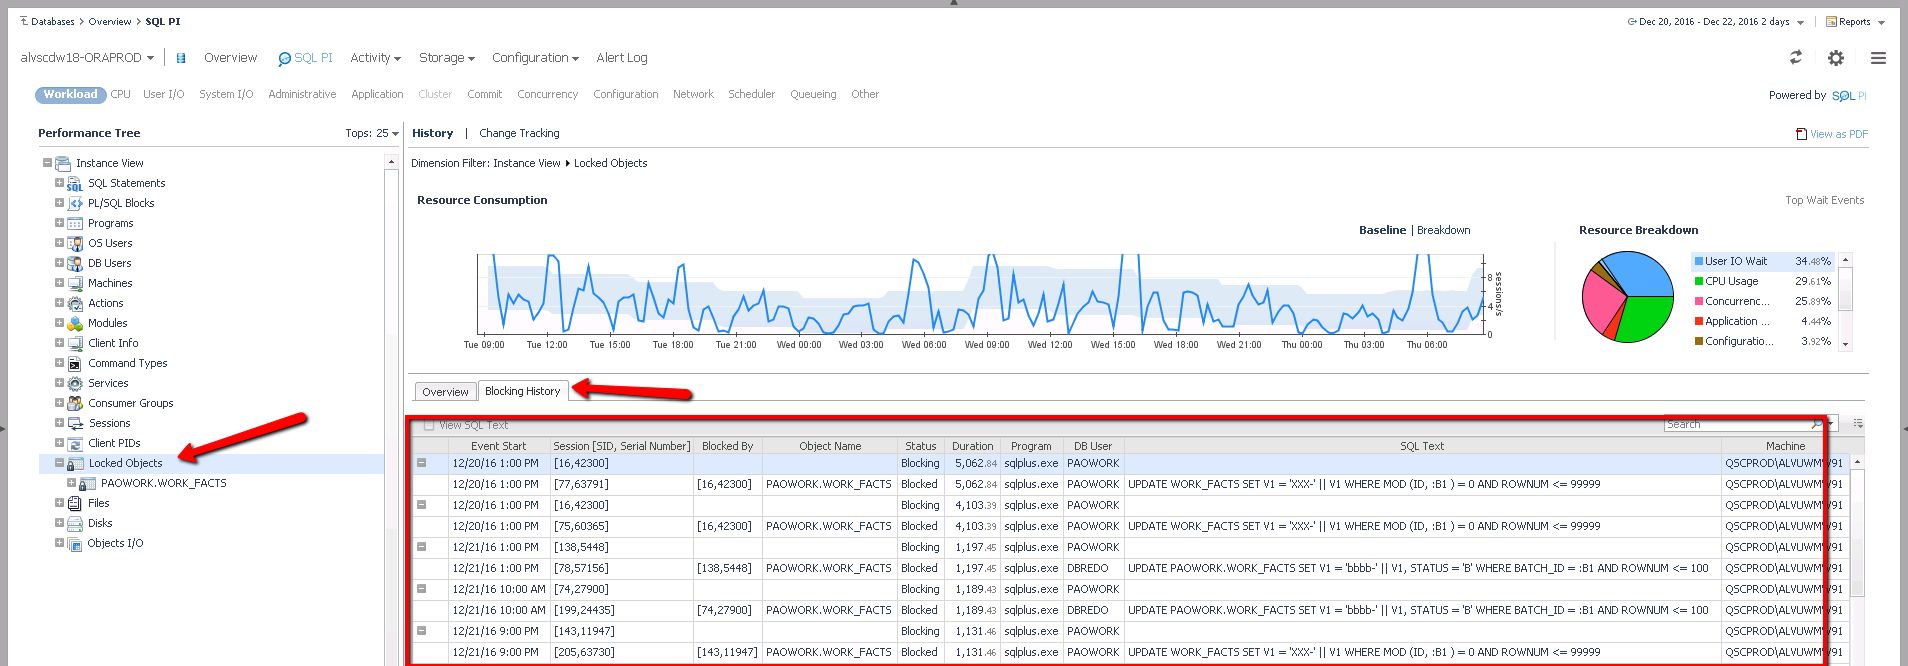
- Oracle Historical Lock Analysis: Performance Analysis for SQL Server has had a Historical Lock Analysis feature for a few releases, which allows DBA’s to understand top blocking scenarios over any time range. Performance Investigator now brings this feature to Oracle. A DBA can choose any time range, and then view the top locking scenarios broken down by object, with all of the context (users, applications, machines, and queries involved).
As you can see, in addition to the architectural advantages that come with moving from Performance Analysis to Performance Investigator, customers will also be able to benefit from several new and enhanced features that come along for the ride. If you’d like to learn more, or perhaps download a trial so that you can try for yourself, head over to the product page!
