System Monitoring is the function of notifying and informing application stake-holders about the effectiveness of a company’s IT investment. The stake-holders range from business people that own or depend on Software applications, to the administrators that care for the underlying infrastructure. While there are other criteria that define System Monitoring, the basic functions of notifying and informing are core and should be well understood. In this blog post we’ll take a slightly deeper look at 3 core areas of System Monitoring; notification, informing through reports, and informing through dashboards.
Notification is typically done when something being measured by a System Monitor deviates from its norm. The ability to compare a collected metric against a static threshold is basic, and the ability to have a more intelligent threshold that varies based on historical norms is more advanced. Another more advanced feature of notification is to derive the metric that is being measured. For example, alerting when the average CPU utilization is over 90% is basic, notifying when it’s over 90% and the process run queue is over 10 is more advanced, and notifying when more than half the cores are at 90% CPU is yet more advanced. Things like workloads or completion rates get even more advanced as complex derivations and multiple metrics come into play. When you think about alerting and notification be sure to understand the potential to vary, derive, and get creative with both the metrics side and the threshold side of the equations. People are often amazed when they learn of some of these more advanced capabilities and the power they bring.
Value in reporting comes primarily from trends. Reports are most often used by people that make the IT purchasing decisions, or by the Engineers that determine capacity needs. Reporting can get more advanced in looking at multiple time periods. For example, compare this week’s volume to last week’s. Another advanced feature is to group different items into something complete. For example, one might consider the application to be compliant when certain transactions are under a specified performance delivery time, and the systems are under a specified amount utilized. One extremely high-value area that is often overlooked with System Monitors is that they can be used to measure and report on business metrics. This is especially true in e-commerce environments where it’s relatively easy for System Monitors to see both successful and unsuccessful transactions. System Monitors may even contain valuable evidence as to what might be impeding business performance.
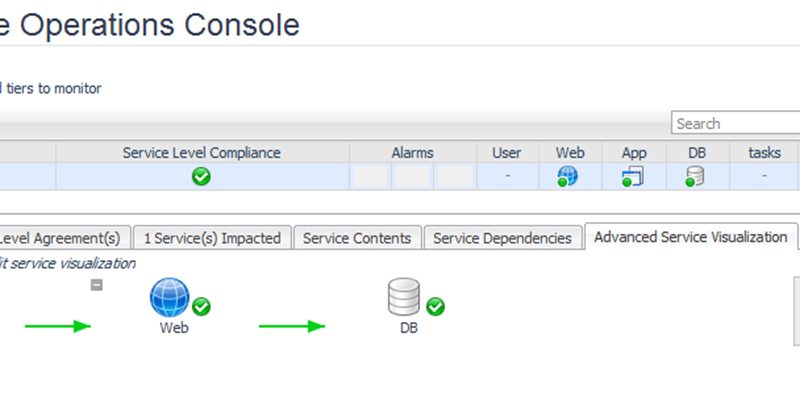
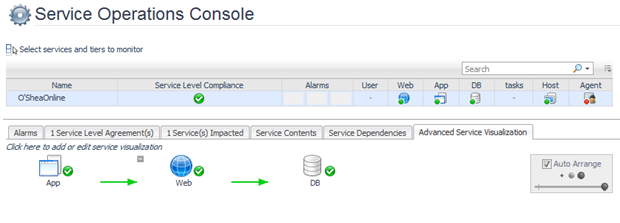
Dashboards are most useful to give users a real-time and recent history look at a system or sets of systems. At the very basic level users may need to look at a single host and see its status. Most System Monitors can accommodate this in a dashboard that allows searching by hostname and seeing things like CPU, memory, disk utilization, and storage capacity. It gets more advanced when users are trying to assess the current status of applications that span multiple systems. It’s not unusual, in large enterprises, to see hundreds of servers supporting a single application. This is arguably the largest challenge for System Monitoring vendors. Where its relatively simple to look at a specific host, database instance, or even a business transaction, it is challenging to track and understand when things aren’t as they should be when you have hundreds of nodes and hundreds to thousands of potential transaction paths through those nodes.
When it comes to System Monitoring, the Foglight organization is made of hundreds of members that understand the needs and desires of larger Enterprises. My team focuses on Enterprise Customer Success for Enterprise System Monitoring. The System Monitors that we work with are configured to monitor hundreds to thousands of nodes for 100+ applications. In a smaller percent of the cases, there are configurations that are using Foglight to monitor a specific domain such as the database or application domain. In future blog posts we’ll be sharing some examples of how to stretch System Monitoring features to accomplish some of these more advanced use cases for the Enterprise. Our hope is to help our customer base find unrealized benefits of their System Monitoring platform.