
One of the primary needs of those responsible for maintaining the health of database environments is to efficiently find poorly performing queries. Are there resource-intensive queries running? Are there long-running queries running? Who is running them? Against what databases are they running them?...and so on. To add to the complexity, it is also often the case that this investigative work needs to be done against queries that ran several minutes, hours, or even days ago. Without an accurate and straightforward means of identifying bottleneck queries, it's common for Administrators to simply tell the end-users, "you're running bad SQL...' It is mutually beneficial (for DBAs and end-users) for those DBAs to be able to quickly find the culprit and share that information. It arms DBAs with evidence/proof to provide to the end-users...and the end-users can make the necessary changes with confidence. This helps with the immediate performance situation but also may assist with longer-term performance improvements.
Hence, this blog title... Analyze It...Don't Criticize It.
Quest can help. Upon diving into the Quest performance monitoring and diagnostics solutions, you'll likely notice that there are a few options available to you. The solution highlighted in this blog is Spotlight Cloud (SPC).
SPC is specifically designed to diagnose performance in SQLServer environments. What's more, SPC is a SaaS solution. *There is no bloated on-prem install (*the architecture does require a simple Windows service to run on-prem). The architecture largely resides in the cloud. This includes a SQLServer Repository (with 1 year of retention). So, there is no need to install, maintain, and use your own SQLServers.
If this sounds like what you're looking for, read on. SaaS deployments are growing in popularity and more and more, IT standards are suggesting (or requiring) that SaaS solutions be adopted.
As an additional reference, have a look at this blog detailing SaaS advantages.
Signing up for the service and configuring your instances to be monitored is easy. Click here to sign up. https://www.spotlightcloud.io/
So now, you are ready to take in the goodness of SPC. (Wow, that was fast!)
As discussed above, to identify those problematic queries, navigate to SPC's 'Workload Analyzer'.
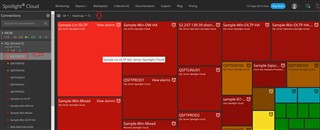
The initial dashboard displayed is the Heat Map. Either click a box (representing a registered/monitored SQLServer instance) or select one from the navigation tree on the left side.
(Click on images to enlarge)
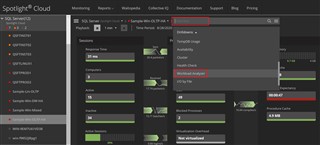
At the top, select the dropdown next to 'Overview', scroll down, and select 'Workload Analyzer'.
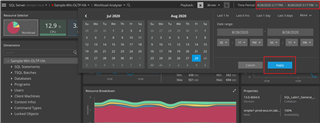
From here, select the date/time in the top right to open the time selector interface. You can use the calendar or pre-defined windows of time.
(In my example, I chose 'Last 6 hours'.)
*Then, be sure to select the 'Apply' button. This is especially important on this dashboard because otherwise, the dashboard will continue to refresh as you attempt to navigate and drill into data dimensions.
Choose the 3 parallel lines (top left) to maximize the screen (hide connection tree).
Across the top, there are filters for the resource consumption/activity you'd like to view. 'Workload' is the default (essentially, a combination of all of the others to the right of it).
Note the 'Data Dimension' tree on the left side. Simply, expand any of the 'data nodes' to start your analysis. There is not one particular correct way to navigate.
For example, perhaps you'd like to better understand what databases within this instance are experiencing the heaviest workload. Expand the 'Databases' node. Upon doing so, there's a list of databases that experienced workload in that timeframe. Any time you drill into a dimension, it lists in order of most to least. So, in this example, I drilled into Databases>Users>a particular user> Statements.
With just a few clicks, I am able to see that the Sales database within this instance is experiencing the most Workload. By drilling in further, I can see the user generating the most workload, and the statements he/she is running in that 6-hour time frame.
In this example, it is also easy to see that the largest amount of the Workload is Locking activity.
To verify the statement involved, I have selected the Lock filter. It displays the offender.
*(The Locked Objects node at the bottom of the tree will provide more information about the activity.)
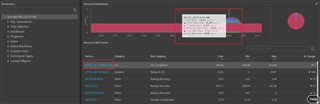
By navigating back to the Instance level and viewing the Workload Analyzer dashboard, you'll notice several useful panes of data.
Understanding Workload offenders is important. Equally important is the associated Wait Events.
View this information in the Resource Breakdown pane. Maximize the pane by selecting the diagonal arrows located at the top right of the pane.
There's plenty to absorb and take advantage of with the power and flexibility of the SPC dashboards...too much to review all of it. To point out a couple of items, notice the wealth of hover-over information available.
Also...not sure what exactly one of those Wait events is? Just click on the name of the wait Event (link) and a site called 'Waitopedia' will launch to provide definitions and guidance.
Click here to learn more. https://www.spotlightcloud.io/products
Yeah, Mon.
