

We are very excited to announce the general availability of Foglight for Databases v5.9.7.20, featuring the new Performance Investigator (PI) for Azure SQL DB.
Background
PI is one of Foglight’s most popular features. Its main functionality is multidimensional analysis, which brings deep visibility into complex database performance challenges. Multidimensional analysis enables users to drill down, slice and dice workload data, and get clear visibility into performance bottlenecks. For example, a Foglight user can easily drill into a list of applications to find the one with the most load, and then drill into that application to view the top users or see SQL statements for individual users. Each user session can be individually investigated.
Using Performance Investigator for Azure SQL DB
Enabling PI
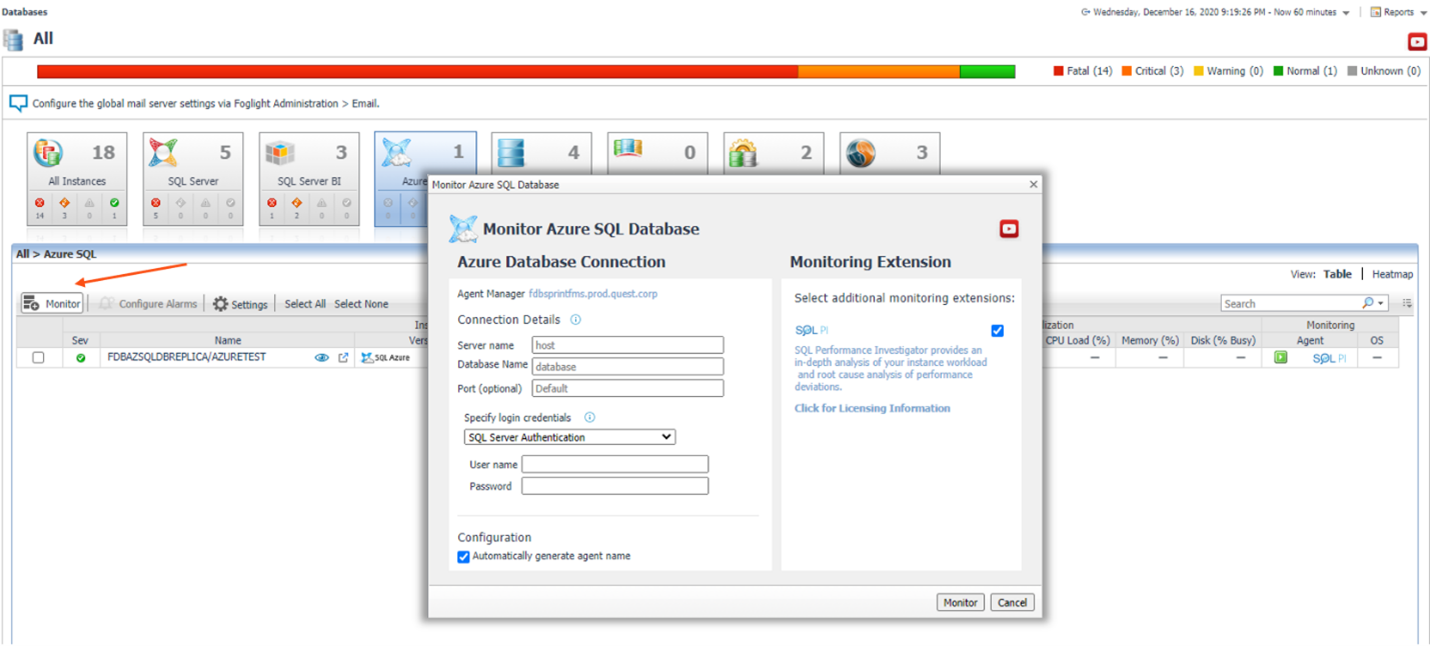
Enabling PI functionality when monitoring a new Azure SQL database is very simple. It only requires the user to click on the “SQL PI” checkbox in the monitor wizard, as follows:
Accessing PI Functionality
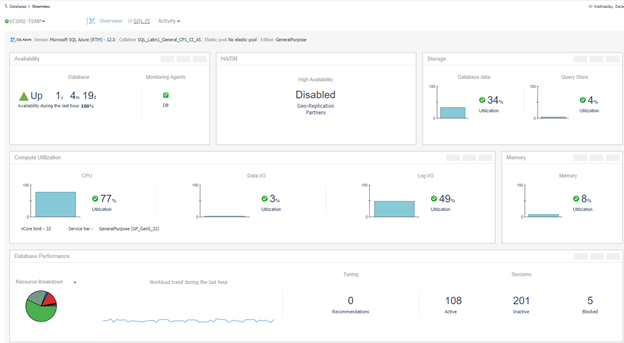
Once a new Azure SQL database is monitored by Foglight, it is possible to access PI directly from the global view by clicking on the “workload” column or alternatively, on the Azure SQL database overview page, the user can access PI by clicking on the “SQL PI” tab in the menu:
Multidimensional analysis
On the “SQL PI” tab, the multidimensional analysis feature is presented to the user:
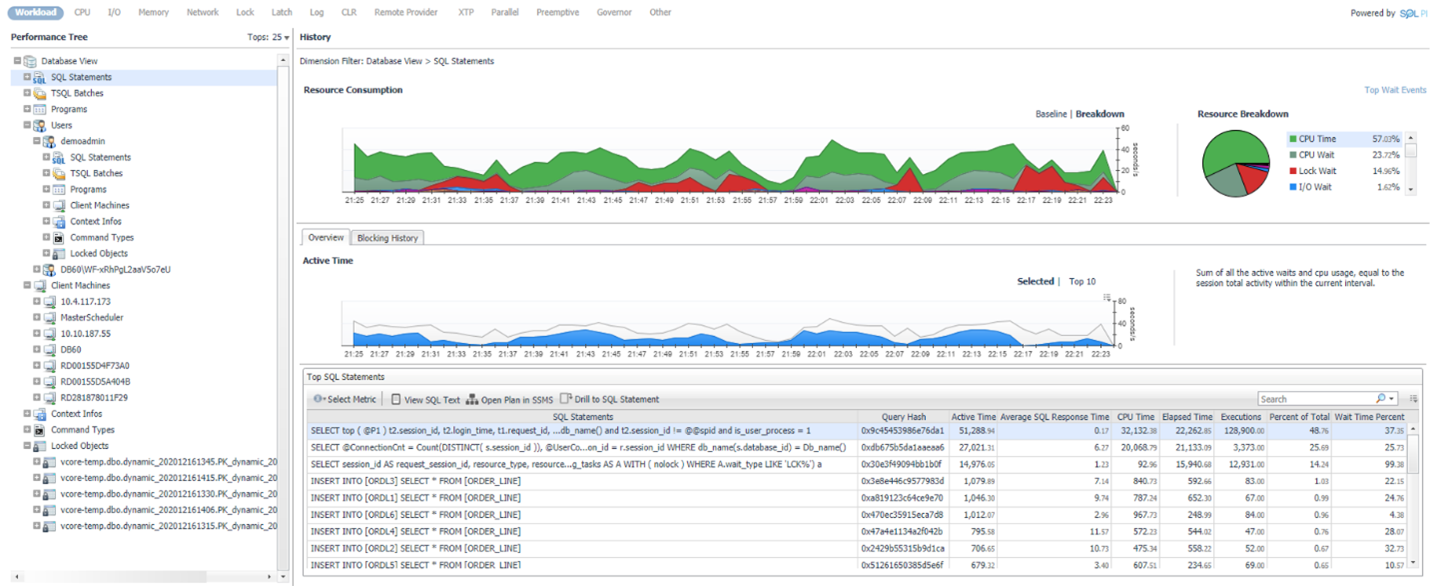
From here it is easy to navigate in the “Performance Tree” to examine workload activity by the following dimensions:
- SQL statements
- TSQL batches
- Programs
- Users
- Client machines
- Context info
- Locked objects
This provides clear visibility into both real-time and historical database performance issues.
Smart Baseline Algorithm
Another key benefit of PI is the ability to see how the actual workload compares with the automated Foglight baseline range. The Foglight baseline feature is based on a smart machine learning technique which defines the expected workload behavior at different time periods (e.g., the hour of the day, day of the week, week of the month), as follows:
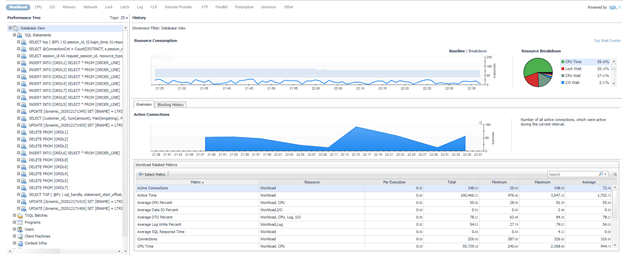
In this case, we can see that the baseline range is higher than the actual workload. This means there is an unusually lower activity level in the database compared to what Foglight expects.
Lock Analysis
Concurrency issues are usually caused by poorly written applications and could be the cause of performance degradations. Foglight PI enables the user to analyze both real-time and historical blocking lock trees which can be filtered by various dimensions.
In the following example, we can see all the lock trees associated to user “demoadmin” that used the “SQLCMD” program:
Each lock tree includes details about both the blocker and blocked sessions, including the blocked resource, the duration of the lock, and the associated dimensions (e.g., user, program, SQL statement).
Summary
Foglight Performance Investigator (PI) is a unique analysis toolset for database professionals which is now available for the following database platforms:
- SQL Server
- On-premises
- Infrastructure as a Service (IaaS)
- AWS RDS
- Azure SQL Family
- Managed Instance
- Single Database (new offering in 5.9.7.20)
- Elastic Pools (new offering in 5.9.7.20)
- Oracle
- On-premises
- Infrastructure as a Service (IaaS)
- AWS RDS
