On the Foglight for Databases main dashboard, you can create groupings of instances. These can be used to filter the dashboard, enable easier user-level access, and even allow fine tuning of alarms.
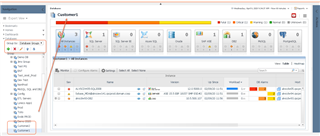
These database groups can also be used in custom dashboards. The hard part was finding where they are located in the Data viewer. From there, it is really easy to create a quick "alarm status" dashboard.
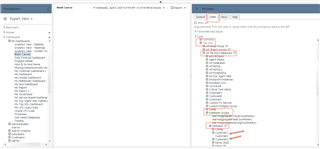
Under the covers, the database groups created from the Databases dashboard are stored as service definitions. These are simply groupings of "things" that Foglight monitors. Things can be high-level at the DB instance or host level, or groupings of jobs, databases, SQL statements, etc. So these are found under the Services -> All Service Categories -> Database Groups -> Definition node on the Data tab. If you created a database group, you should see them there.
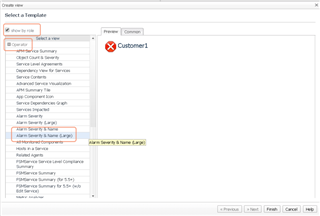
You can select your group name, and simply drag it to your dashboard. "Select a view" is the option to pick.
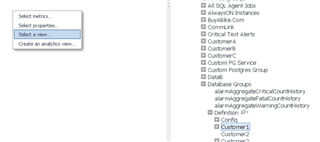
There are a number of pre-built views for dashboarding. For this purpose, I select the "Alarm Severity & Name (Large)" view under the Operator role. You can pick different views to see a preview of how it would look before committing.
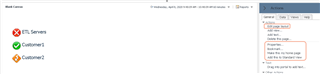
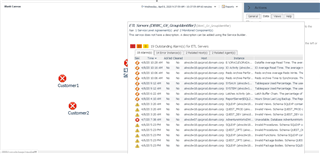
You can continue to drag additional groups to the dashboard. There is a "use previous selection" option that makes it easy. This particular view is already defined with "hover" and "click" flow actions, so hovering over your group will show a pop-up of current alarms.
You can use the options on the General tab to change the layout of the dashboard, to bookmark it, etc. Under Properties -> Link to this page, you can find options to share the dashboard with others.