In this post, I alluded to 2 ways to capture VMware metrics with Foglight for SQL Server.
The steps below apply to SQL Server running on Windows only. Since VMware Tools pulls metrics into the VM, we can access those by querying the WMI Performance Counters.
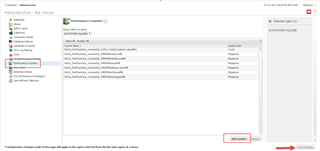
To start, select the instance(s) to configure from the Databases dashboard, then go into Administration and select Performance Counters. Selecting Add Counters will retrieve the available counters from the Windows host.
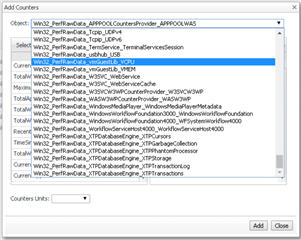
We are interested in the classes Win32_PerfRawData_vmGuestLib_VCPU and Win32_PerfRawData_vmGuestLib_VMEM
Selecting one will show the available counters for that class. You will need to specify the units for the counter (Count generally works as a default.) You'll need to remember that for later.
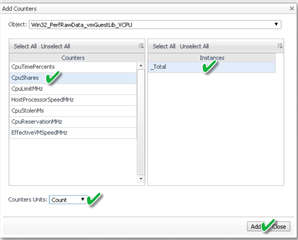
Add the counters you wish, and don't forget to save changes on the way out.
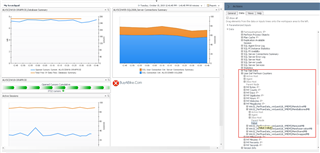
The counters are available on the User-Defined -> Performance Counters dashboard.
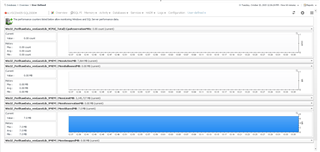
Since those counters will be treated like other Foglight data, they can also be added to a custom dashboard.
In the topology, they are stored under each SQL Instance in "User Def Perfmon Counters" with a sub-type corresponding to the Units that were picked when setting it up. Under that, you will see the counter name and a Value metric. You can drag that to the dashboard and pick how it should be displayed.