
“The Only Thing That Is Constant Is Change “- Heraclitus.
Development, new applications, upgrades, patches, maintenance, schema updates…the list goes on and on around ways that changes are introduced into your environment. Sometimes these changes improve system performance and other times, they have unintended consequences and break something. Either way, if you are tasked with maintaining the overall health of your mission-critical systems, it is essential to understand the changes made, the time frame that these changes occurred, and in some cases, who made the changes. Correlating alterations to performance degradation (or improvement) can lead to dramatic efficiency gains when monitoring performance and diagnosing issues.
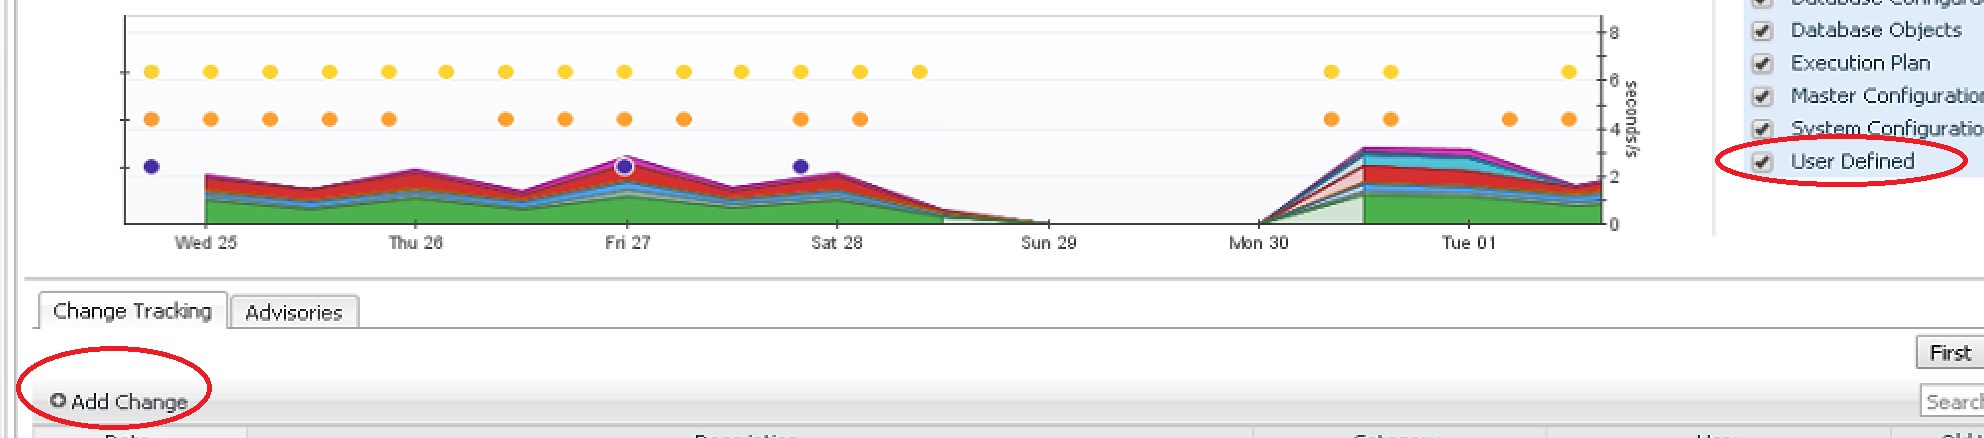
Quest’s Foglight Performance Investigator provides a Change Tracking utility (for SQL Server and Oracle) that plots various change events during configurable timeframes and overlays them on a workload graph. The colored dots represent different change events. The change event types differ a bit between the two platforms. Check or uncheck boxes next to the event types to filter.
* (Click on image to enlarge)
SQL Server:
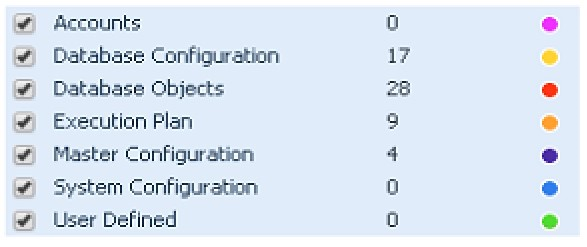
Accounts = Permission-level changes
Database Configuration is just that
Database objects = DDL changes, someone dropped an Index, modified a View etc.
Execution Plan = If a statement ran 2+ times and changed the access path, it's a tracked change
Master Configuration = Any changes to the Master database
System Configuration = Any hardware or o/s level changes
User Defined = Plot/Track your own changes
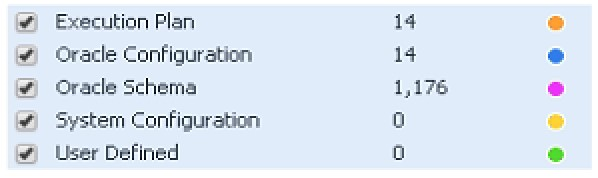
Oracle:
(same definitions as above)
The workflow is as follows:
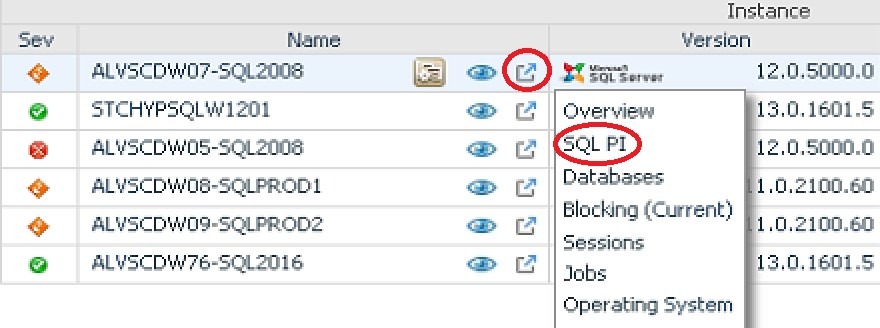
- Within Foglight, navigate to SQL PI (Performance Investigator)
SQL Server:
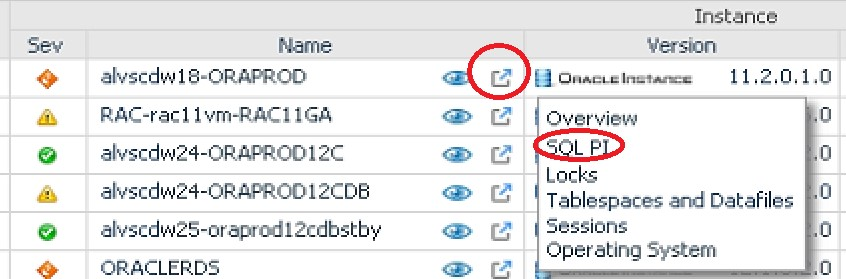
Oracle:
- Choose the Advanced Analytics tab and the Change Tracking tab
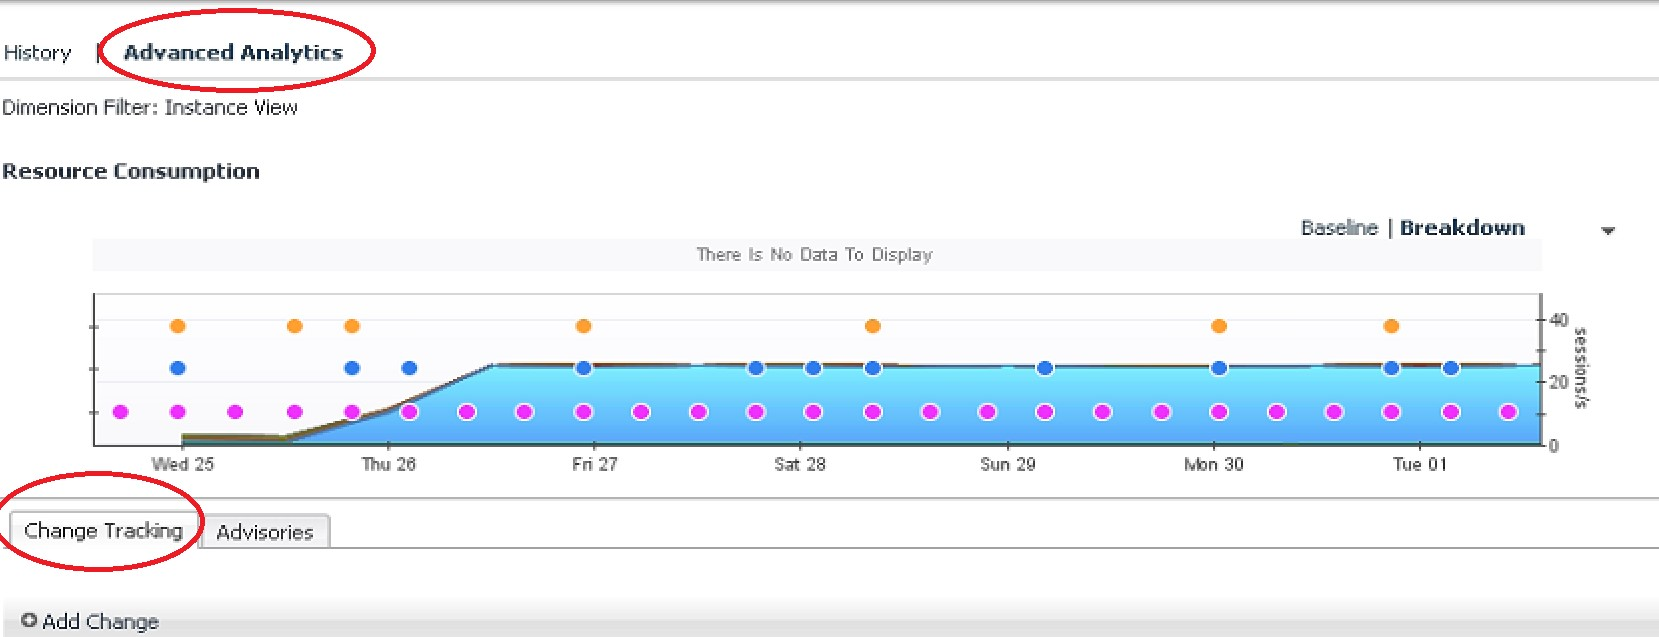
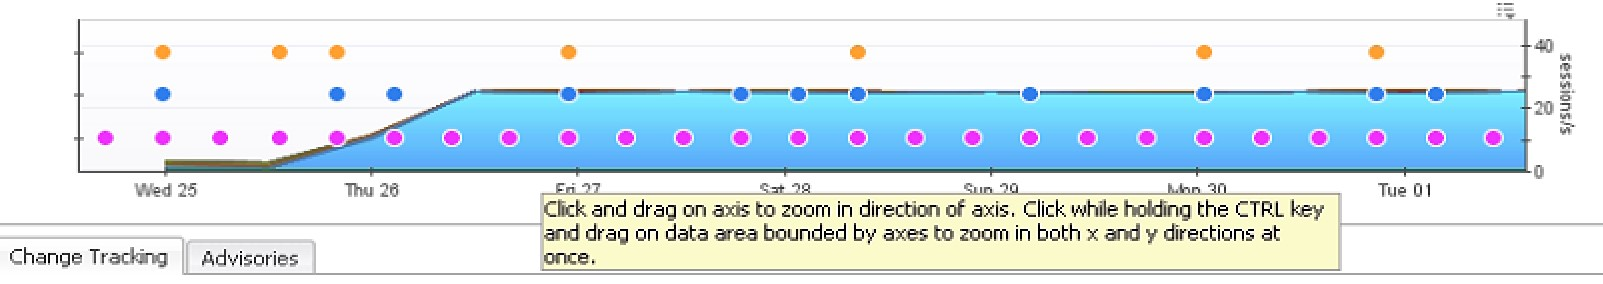
3.Choose your timeframe via a calendar or a window of time with a slider bar (at the top)

- View the workload graph with the change event dots overlaid
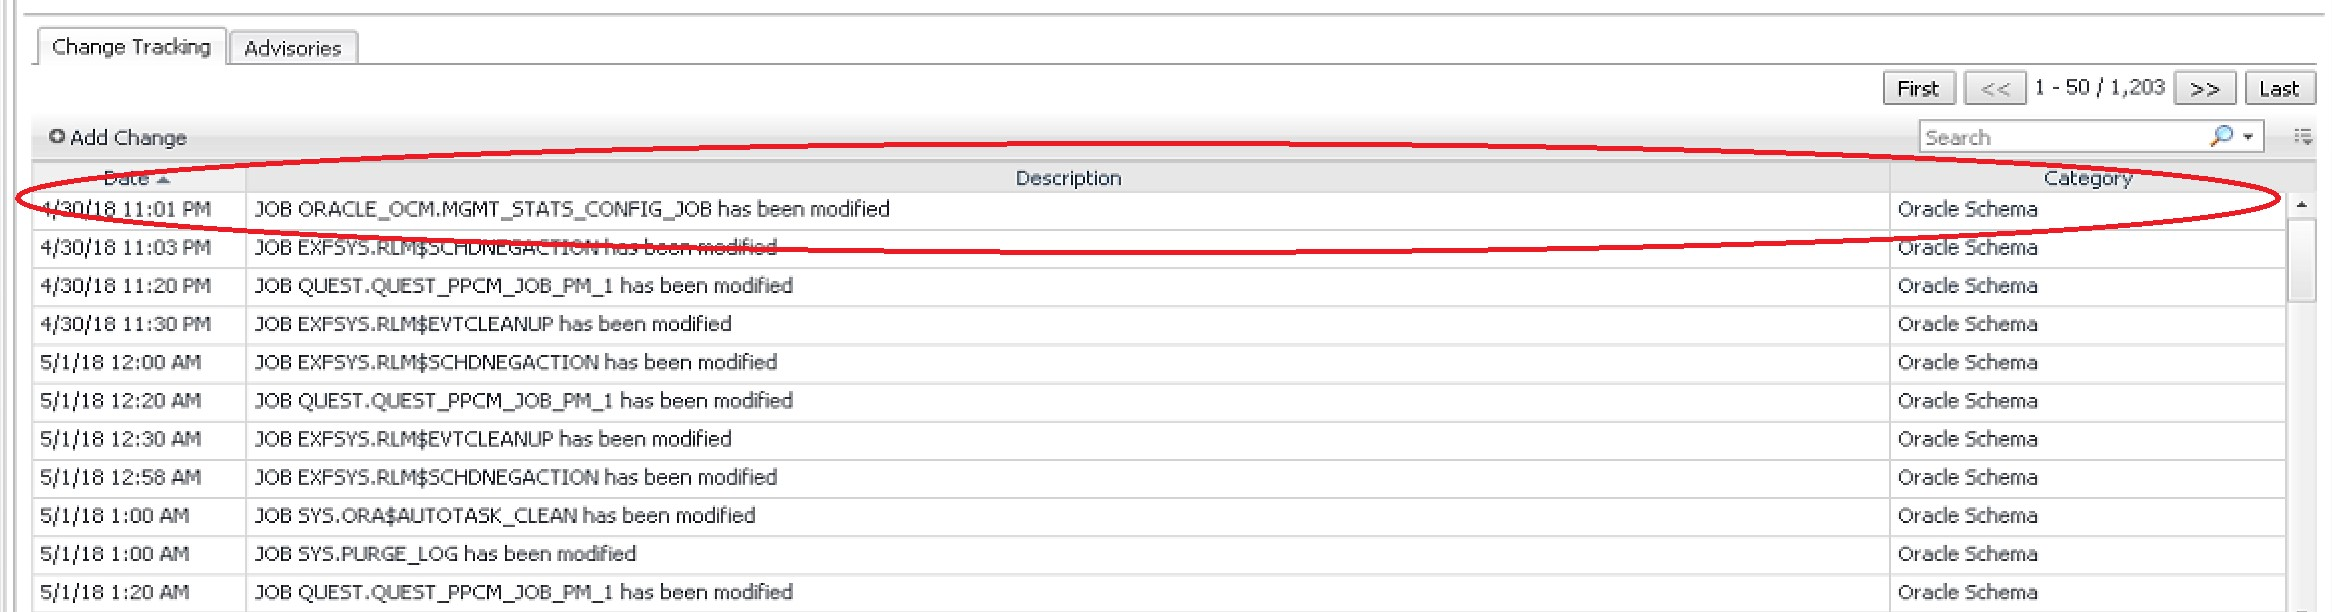
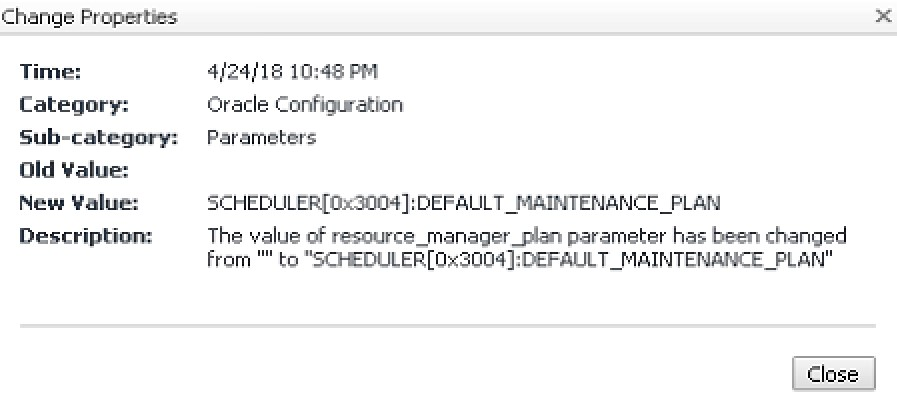
- View the details at the bottom. You can see what change was made, the timeframe it was made, and in some cases depending on the type of change, WHO made the change.
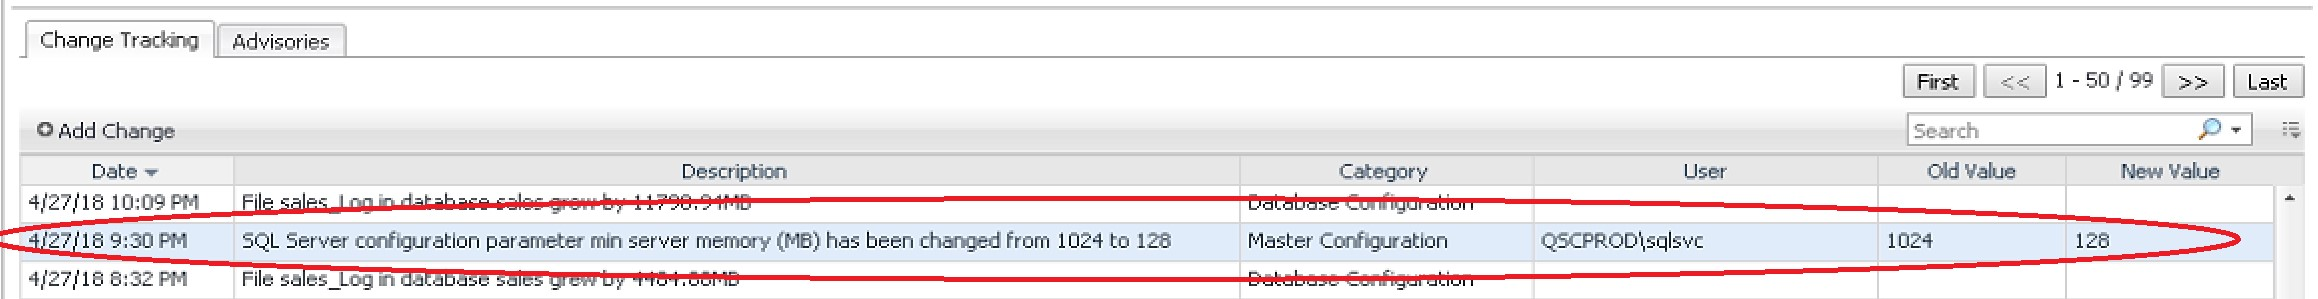
- Click on an individual change for more details.
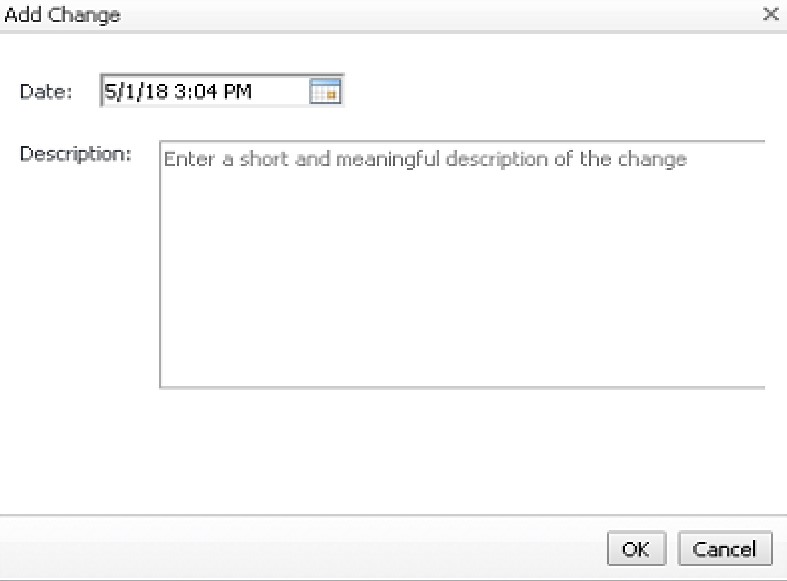
There is an option to plot your own changes too (User Defined). Simply click the Add button. This is useful if you want to track and better understand the effect of your changes....for better or worse. (Did that script I ran improve performance?)
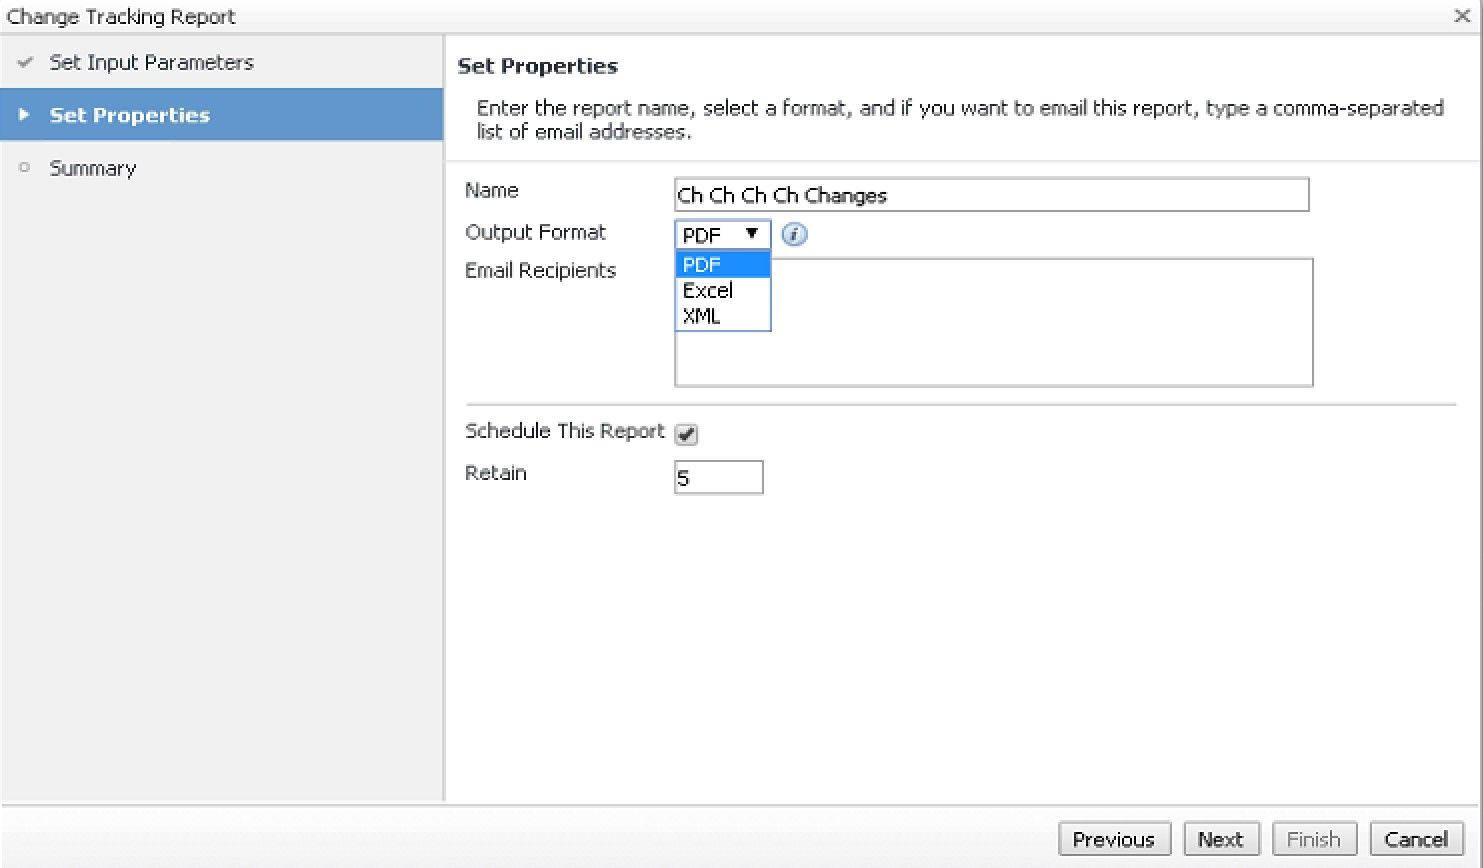
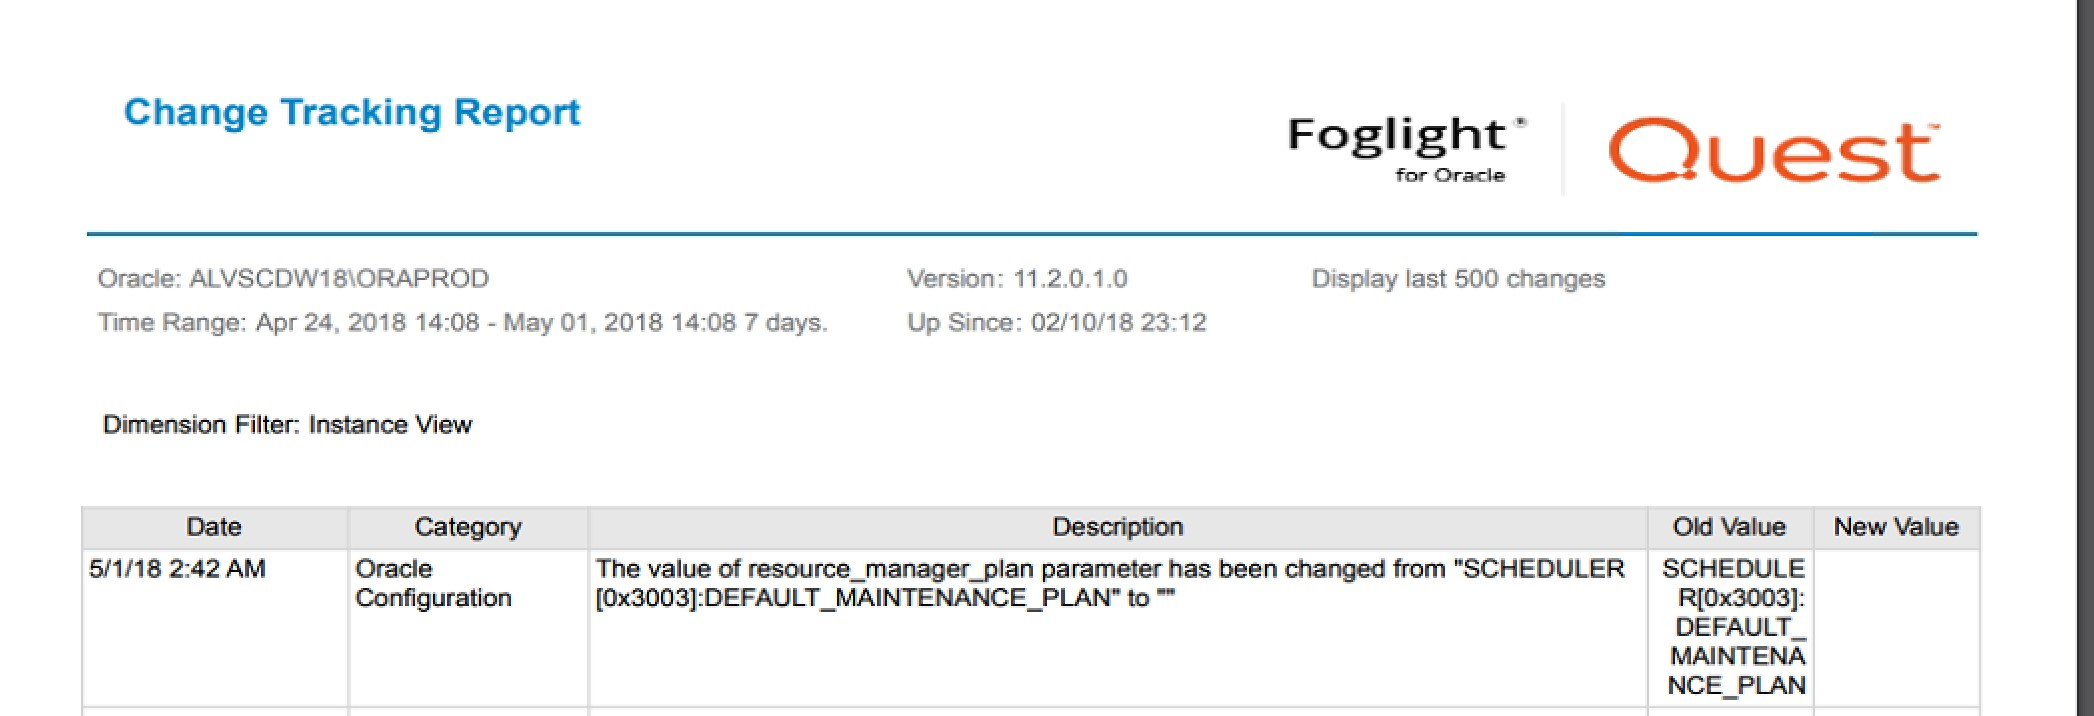
There’s even a Change Tracking report that can be generated manually (top right corner)…
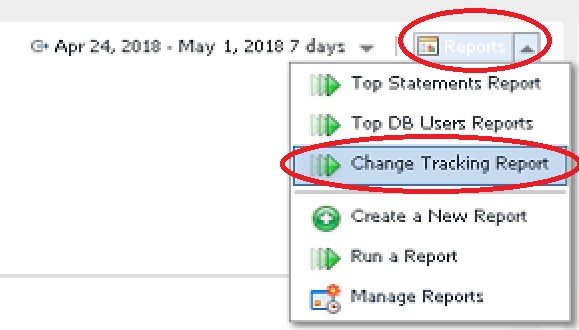
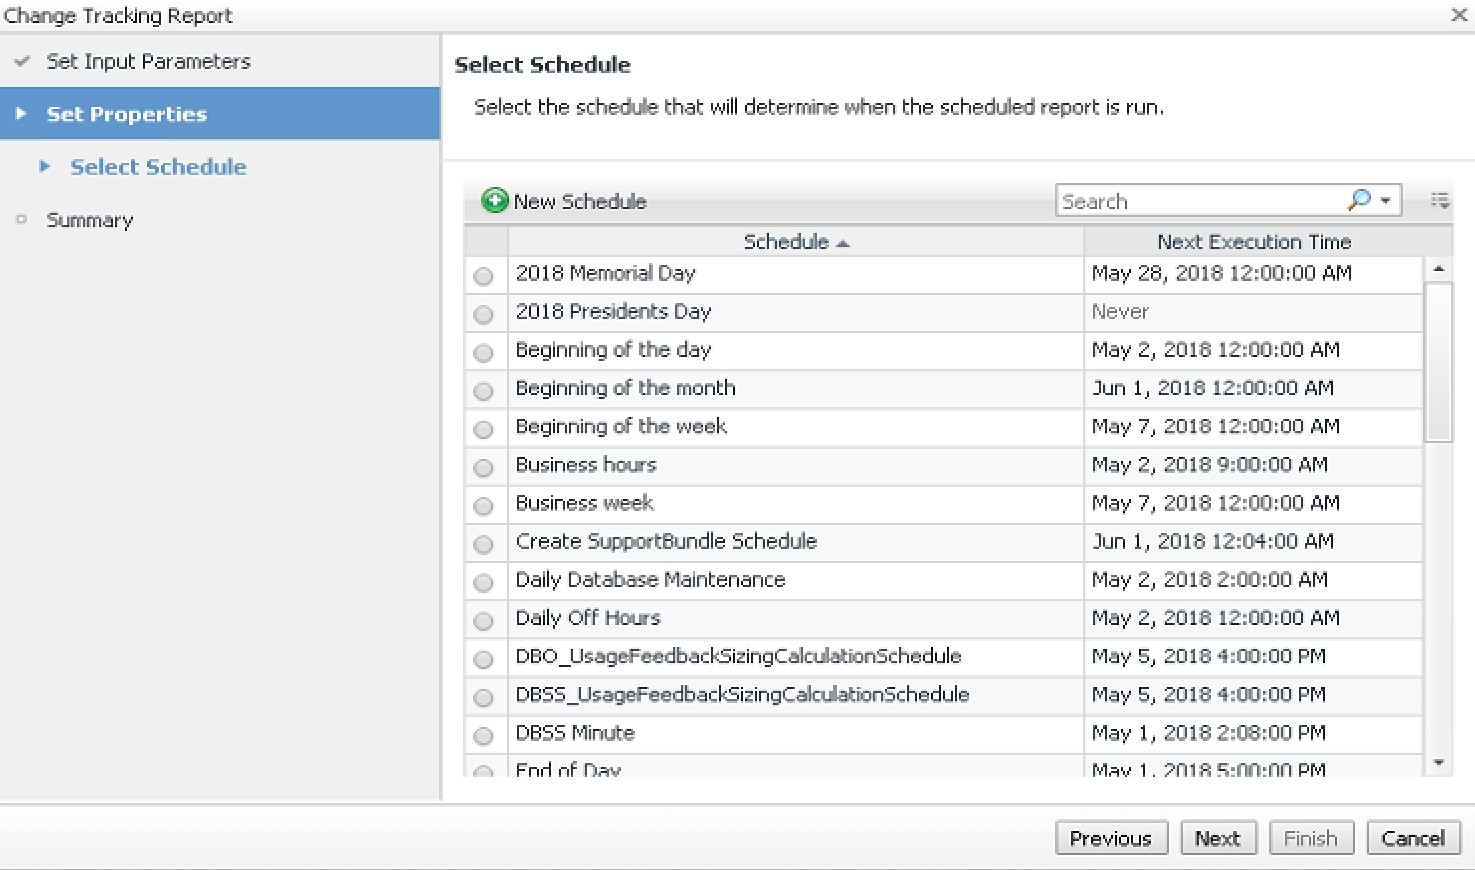
… or scheduled....
For more information, visit Foglight database monitoring and download a free trial.
