Foglight 6 development switched to using Angular for UI components. Examples of these are Alarm Templates, Notification Channels, Audit Log and the fantastic enterprise SQL view Query Insights.
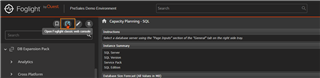
One thing that is not in the new UI is the ability to create custom dashboards and reports via drag and drop. A good example of these are packaged in the DB Expansion Pack.
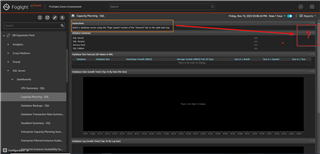
In the example above, the dashboard is looking for an input (eg. SQL instance) and directing you to the right hand panel.. which doesn't exist.
The quick fix is to return to the Classic console. There's a button for it on the left-hand pane, or you can use the URL format of https://your_fms/console
If you use the button, it will open a new tab leaving the Angular UI open. If you use the URL and need to get back, replace "console" with "aui". So this helps with creating new dashboards and reports along with providing inputs to or running existing ones.
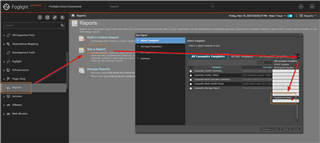
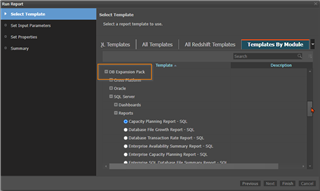
However, if you just need to run a report, you can still do it in the new AUI. Simply navigate to the Reports dashboard and Run a Report.
You'll want to select the dropdown and pick "templates by module". In this example, I'm running a DB Expansion Pack report.
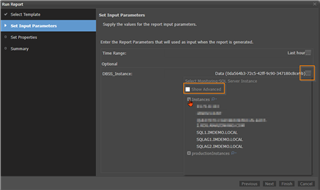
From there, you select the appropriate report, provide inputs (time range, instance, etc.).
A quick tip for the instance selection is to make sure that "show advanced" is not selected. You'll get a list of UI queries that return an instance. Clicking Finish will run the report; Next will provide scheduling and email distribution options.