
Traditionally, DBAs are the ones primarily tasked with maintaining high availability and peak performance of the database environment. Therefore, they assume the responsibility of evaluating Performance Monitoring solutions. This requires identifying the diagnostics needs specific to the environment. With the *DevOps workflow becoming more popular, DBAs and Developers are finding it to be mutually beneficial to find efficient ways to proactively address database performance. As a result, Developers are being asked to provide their valuable input and evaluate tooling as well.
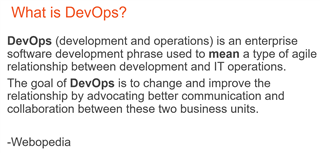
*DevOps - Variations of "What is DevOps?" abound. To level-set, let's reference Webopedia's definition.
(Click on images to enlarge)
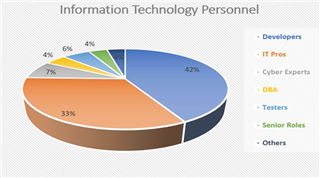
Here's another good reason this makes sense. Simply put, there are proportionately lots more Developers than other IT stakeholders in most environments.
It logically follows that this IT personnel majority should have a say around which efficiency tools to adopt.
Why is this important to the business? I think it is safe to say that collectively, most IT staff has some responsibility for the overall health of the databases that contain the mission-critical data for the business. It may be customer data, product data, process data....the list goes on and on.
If the data isn't accessible and/or there is a lag in entry or retrieval of that data, the business suffers.
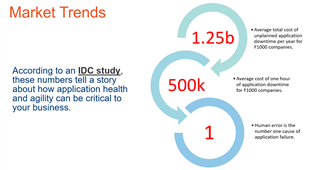
An IDC study uncovered some eye-opening numbers.
With a unified monitoring and diagnostics solution, Developers can play a more active role in this process. It could even be thought of as 'checking one's work'. As changes and updates are introduced into the environment, Developers can have access to the performance metrics and better understand the impact of those changes.
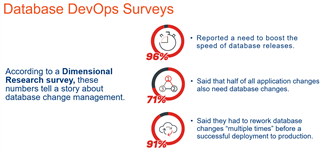
To reference one more survey, these numbers probably come as no surprise to you and reinforce the need for performance data at-the-ready.
Before diving into the topic at hand, if you are a Developer, you may be thinking you may already be familiar with Quest solutions.
Chances are, as you've navigated down your Developer path, you've likely run into a Database Developer tool called TOAD.
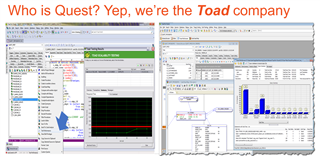
If so, hopefully, your experience with TOAD has been a fruitful one. With that in mind, perhaps Quest's Foglight can assist you with staying abreast of database performance issues.
Developer-centric aspects of Foglight are identified and discussed here.
- The breadth and depth of database monitoring coverage including Developer-driven open-source databases adoption
- The power of Plan Analysis to identify SQL tuning candidates
- The insight of Change Tracking to understand change types and the effect on performance
- The ability to compare performance between different timeframes or across instances
- The flexibility of Custom Dashboards to see only the data important to you
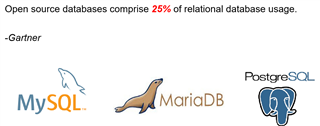
Open-source support: One of the primary value propositions of Foglight is that it supports a cross-DBMS environment with a single web-based interface. Among the platforms supported for monitoring include the most popular open-source database platforms. Database Development is almost always a key factor in the adoption of open-source databases.
Foglight can monitor and diagnose:
MySQL v. 5.0 and newer
MariaDB v. 5.0 and newer
Postgres Community edition v. 9 and newer
EDB Postgres
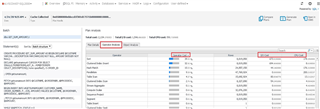
Plan Analysis: Glean valuable information about the query path and the resources it is consuming along the way.
First, navigate to Foglight's SQL 'Performance Investigator' ('SQL PI')
(Note: PI is currently available for MS SQL Server and Oracle only.)
Then, isolate the query you'd like to investigate by drilling into the data dimensions in the navigation tree, choose the timeframe you'd like to search within via the day and date (top right), and select the 'Analyze Plan' button.
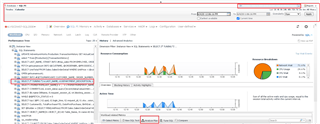
Use the tabs to view and understand the access path, the operations' associated percentage of total workload, and the objects involved.
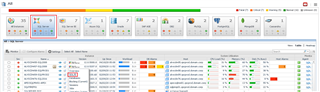
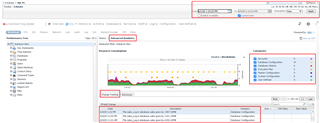
Change Tracking: Identify different change events and understand the impact of those changes on performance as the changes (represented as colored dots) are overlaid on a performance graph.
In the same Performance Investigator (PI) dashboard, select the 'Advanced Analytics' tab, the 'Change Tracking' tab, and the timeframe of your choice (top right).
The legend on the right side details the change event types (filterable via check boxes next to each).
By clicking/dragging your cursor, you can crop/zoom in on a particular area of the graph.
Details of each change are listed at the bottom. Click on any/each for details.
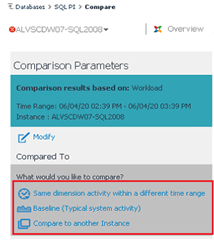
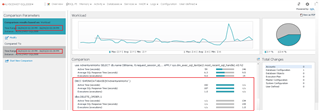
Comparison utility: Compare performance between different timeframes, against baselines, or across instances.
The performance was fine yesterday...why not today? Is this workload normal for this timeframe? If it ran smoothly in Pre-Production...why is it slow in Production?
All of these types of questions can be answered with the information that can be identified by performing comparisons.
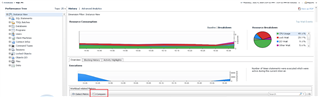
In this first example, yesterday was compared to today.
A DBCC operation happened today, not yesterday.
Yesterday, deletes occurred, not today.
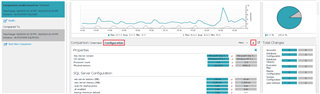
In this next example, two instances were compared (say, Pre-Production to Production)
Note the differences in configuration parameters (that could account for the performance inconsistencies).
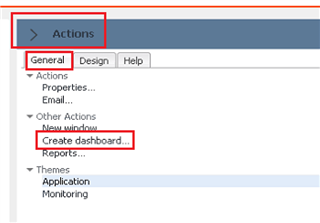
Custom Dashboards: Foglight strikes an important balance by providing several powerful out-of-the-box dashboards while offering the flexibility to create focused custom dashboards for yourself or other stakeholders in the environment.
Open the right fly-out menu (top right), and choose 'Create Dashboard'.
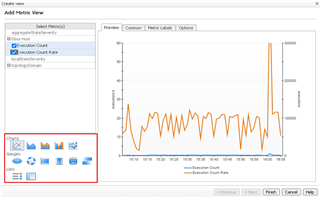
Navigate through a 3-step wizard. Cancel out of the remaining dialog box. Select the Data tab. Find the data you need in the Foglight topology. Drag and drop it onto the workspace.
Choose how you want the data displayed....a graph, a chart, a real-time spinner, a volume cylinder, etc. Select the 'Finish' button.
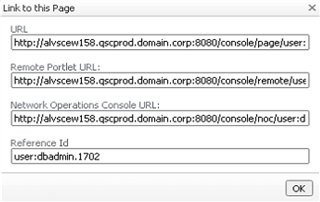
When done, navigate to the 'General' tab > 'Properties' > 'Link to this page'.
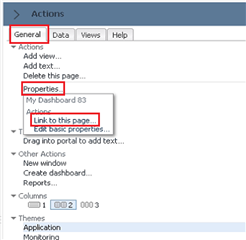
Easily share these dashboards with users via the links.
For more information, visit Foglight database monitoring and download a free trial.
