
Finding where and how things are getting locked up
Aside from IO bottlenecks, locking-related problems are the pains most commonly mentioned in the demos that we here at Quest Software provide for customers seeking database management performance tools. So in this post, we’ll get right to the point of how Foglight for Databases helps you understand these situations in your databases.
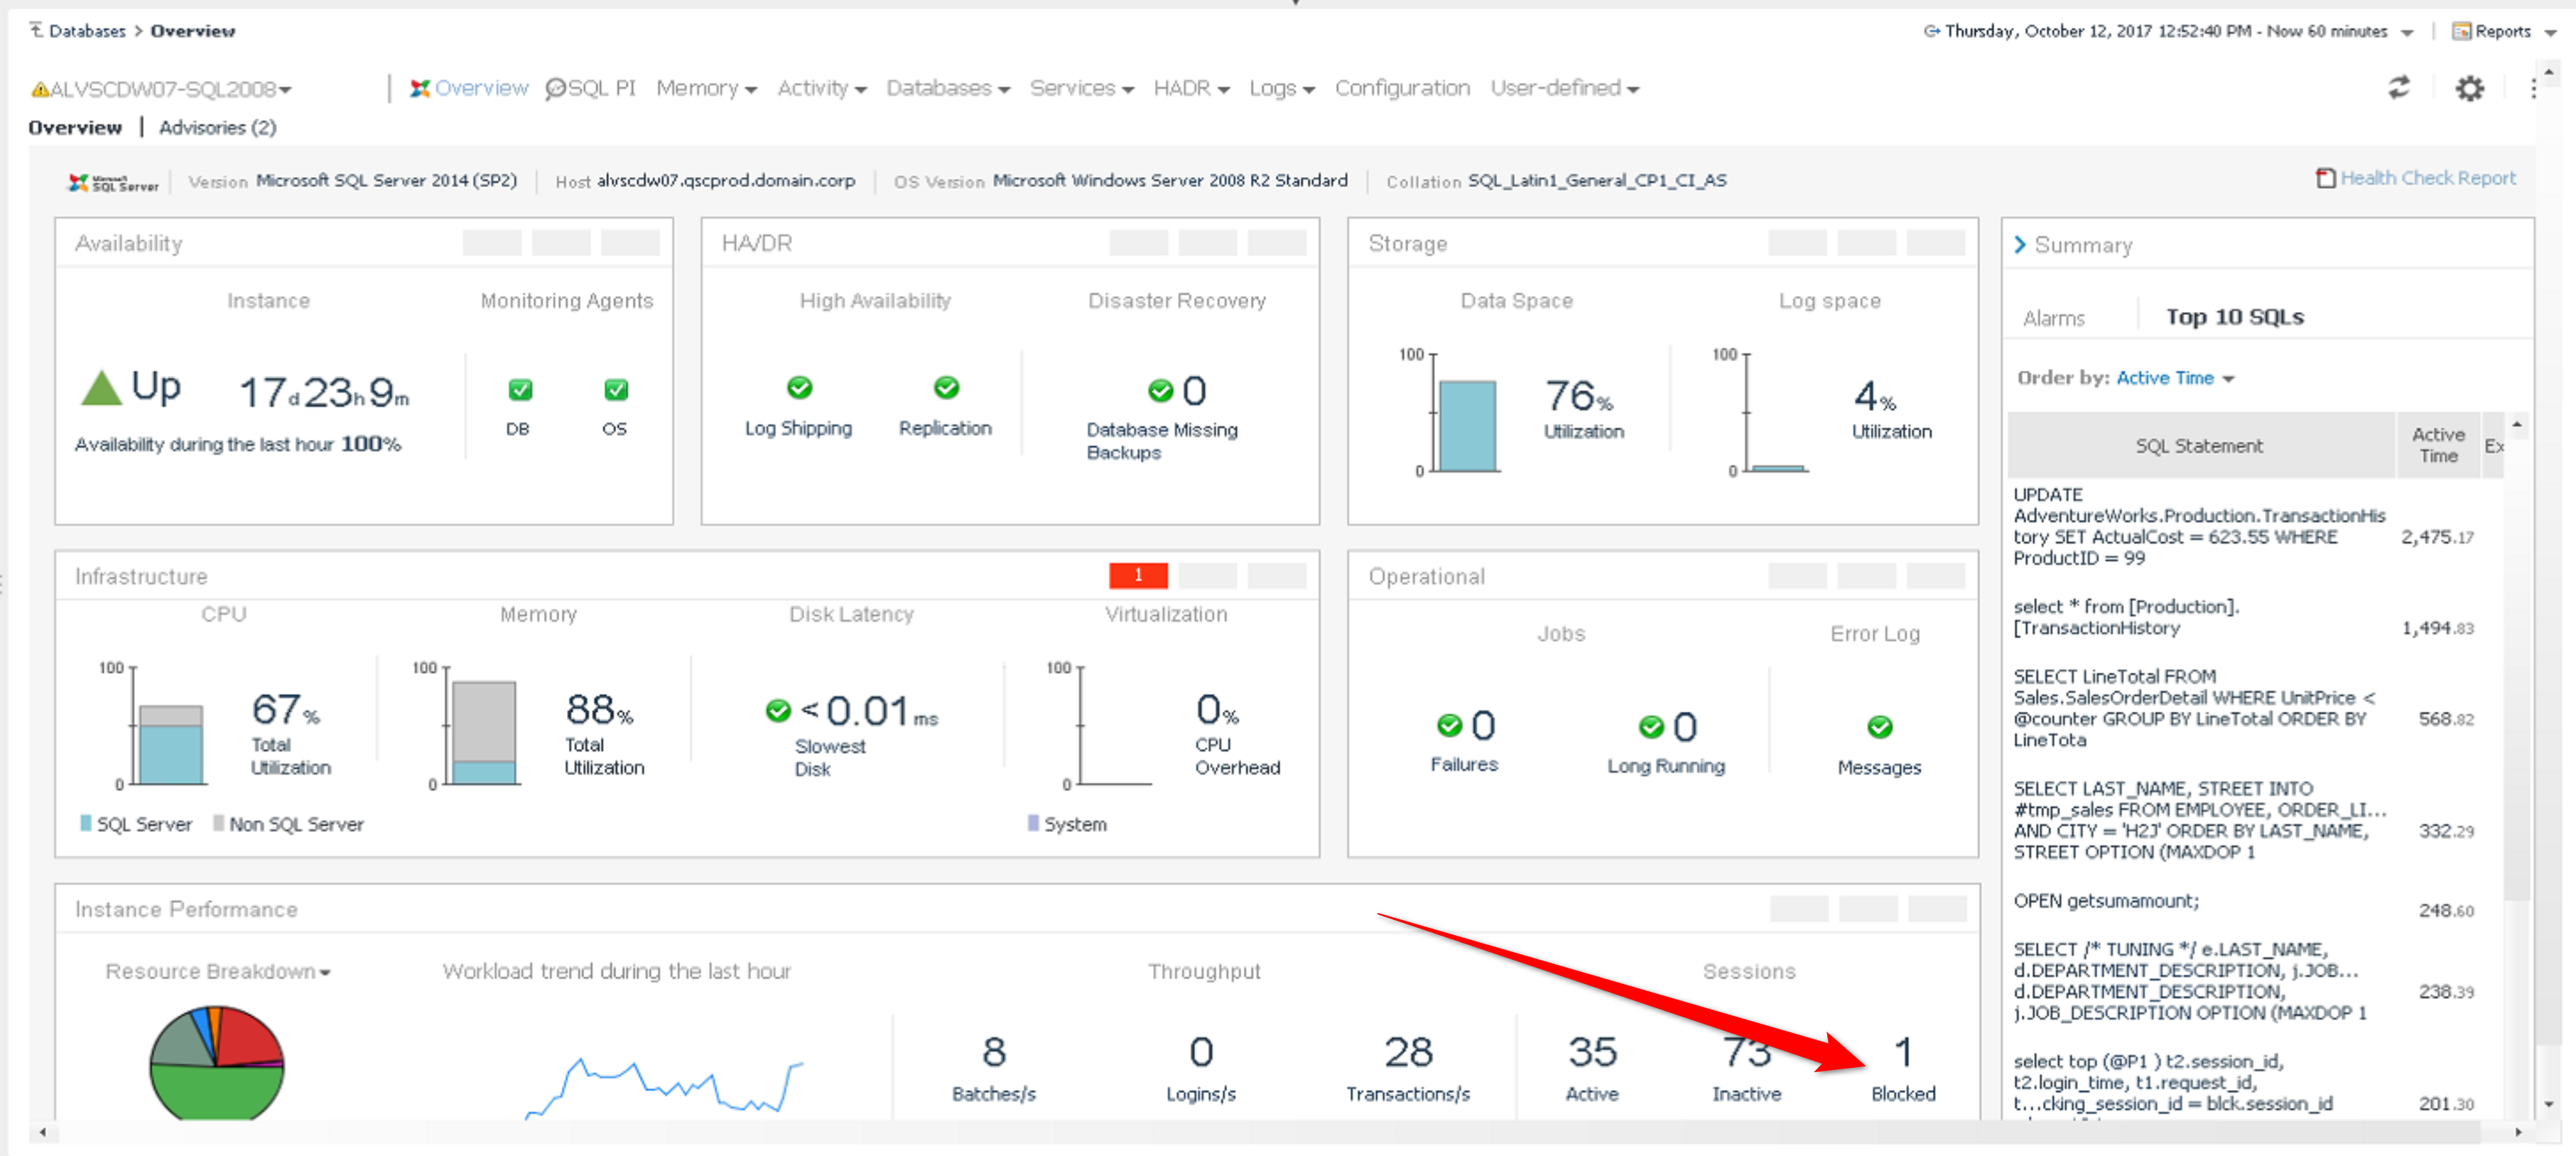
The Foglight Overview page for a given instance can provide a real-time indication of ongoing blocking by giving you the number of currently blocked sessions. You can also configure the Long Locks Running alarm to send you an email notification about it.
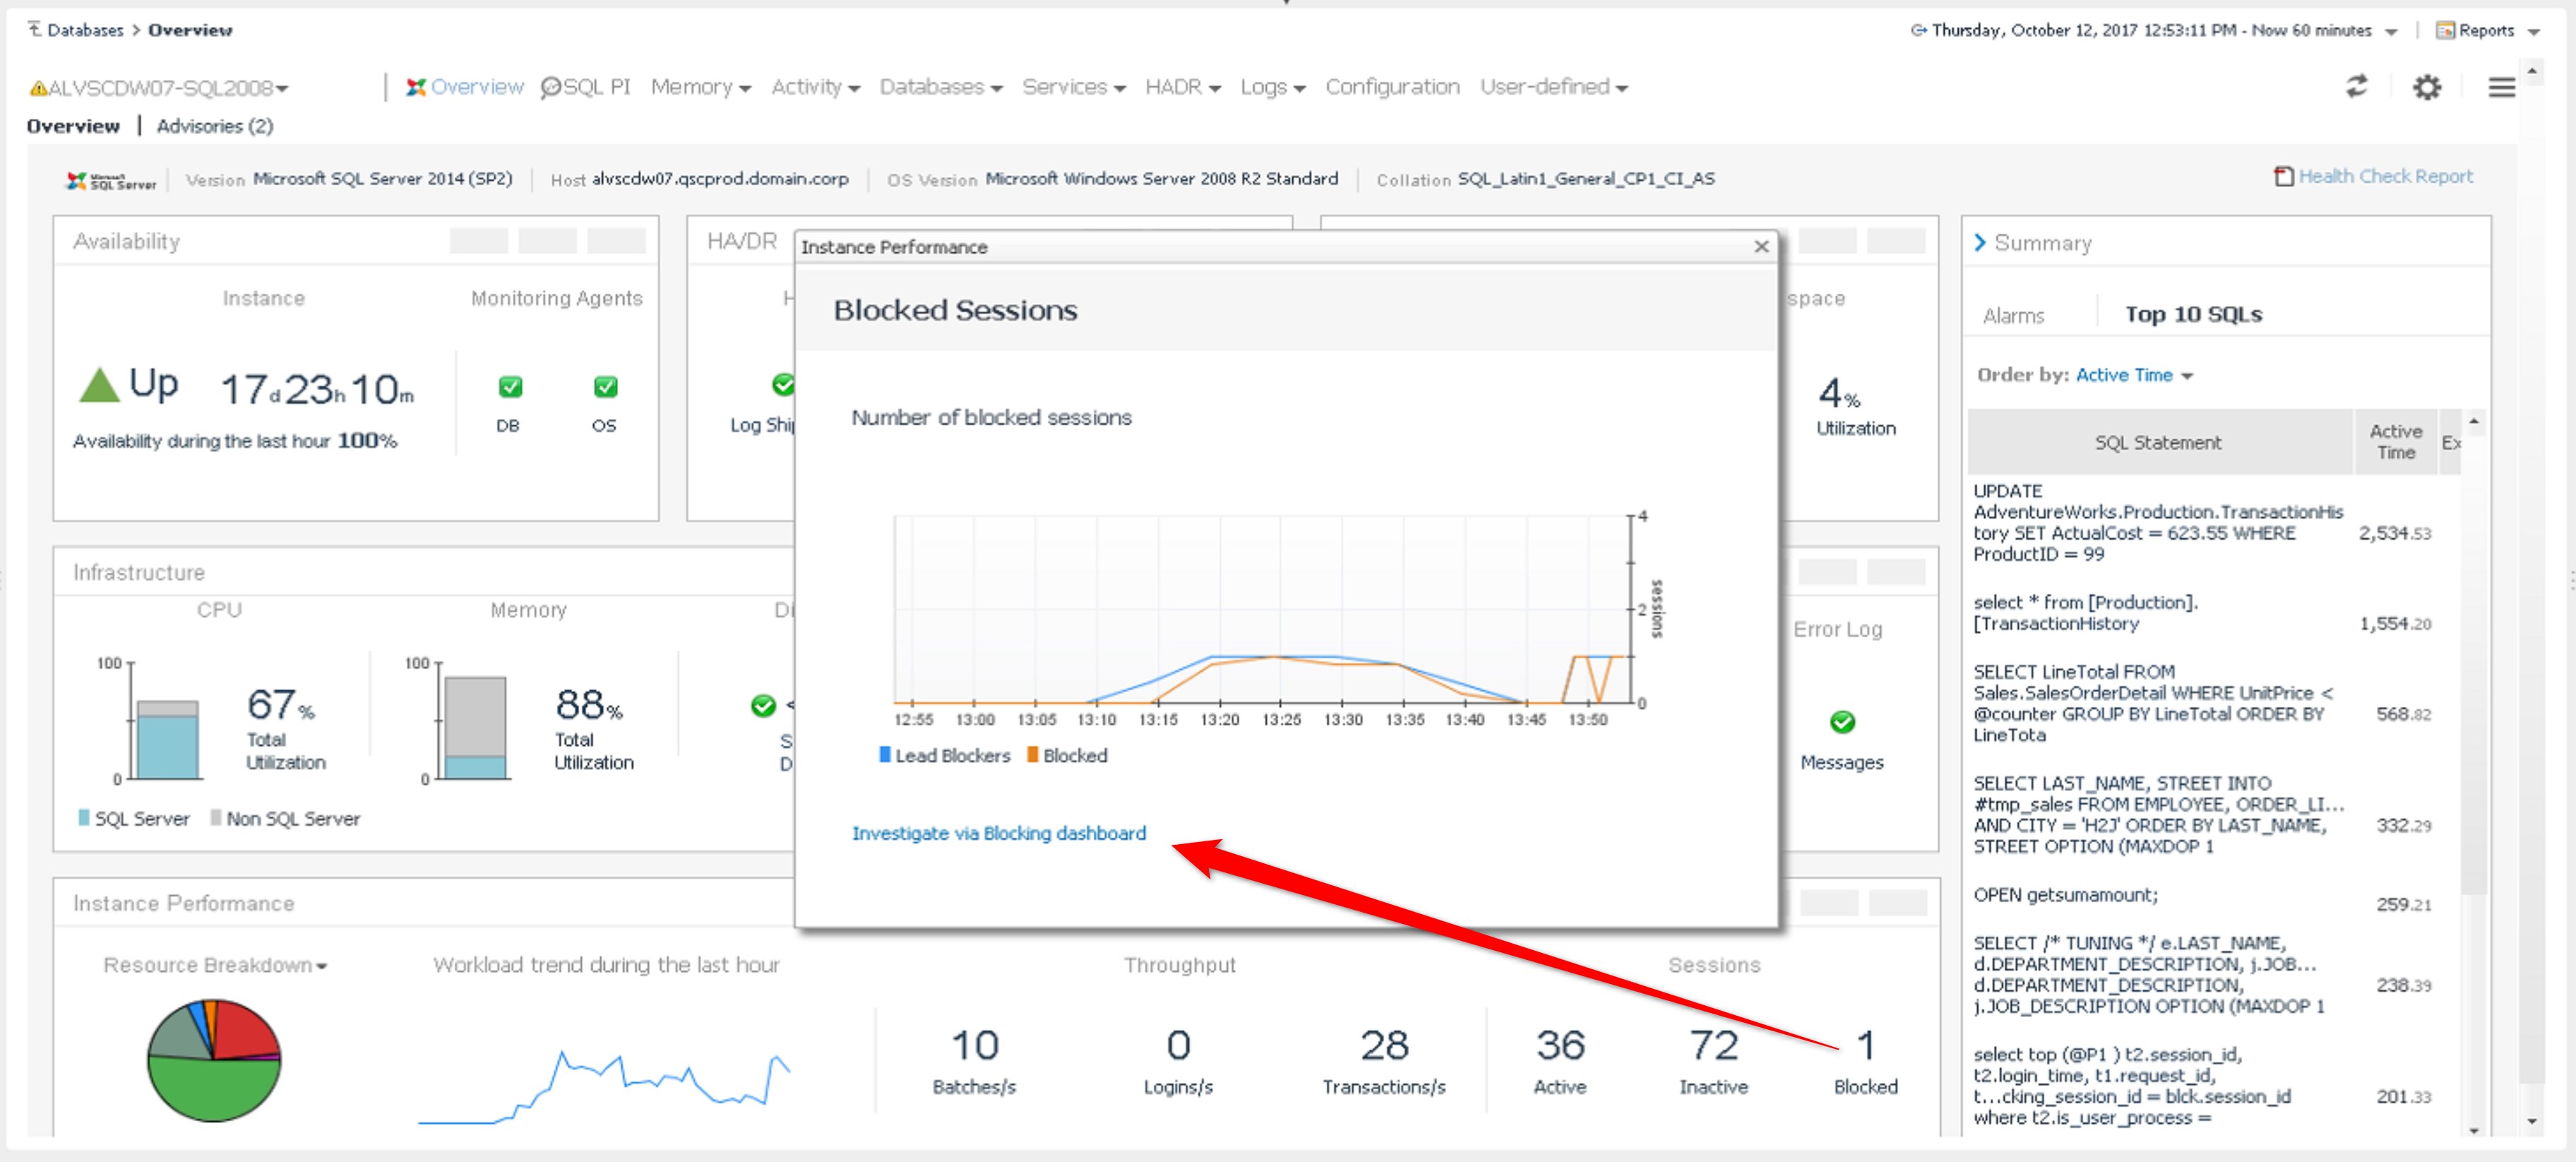
Clicking on “Blocked” on the overview page will bring up a box with a graph of blocking over the last hour, and a link named “Investigate via Blocking dashboard”.
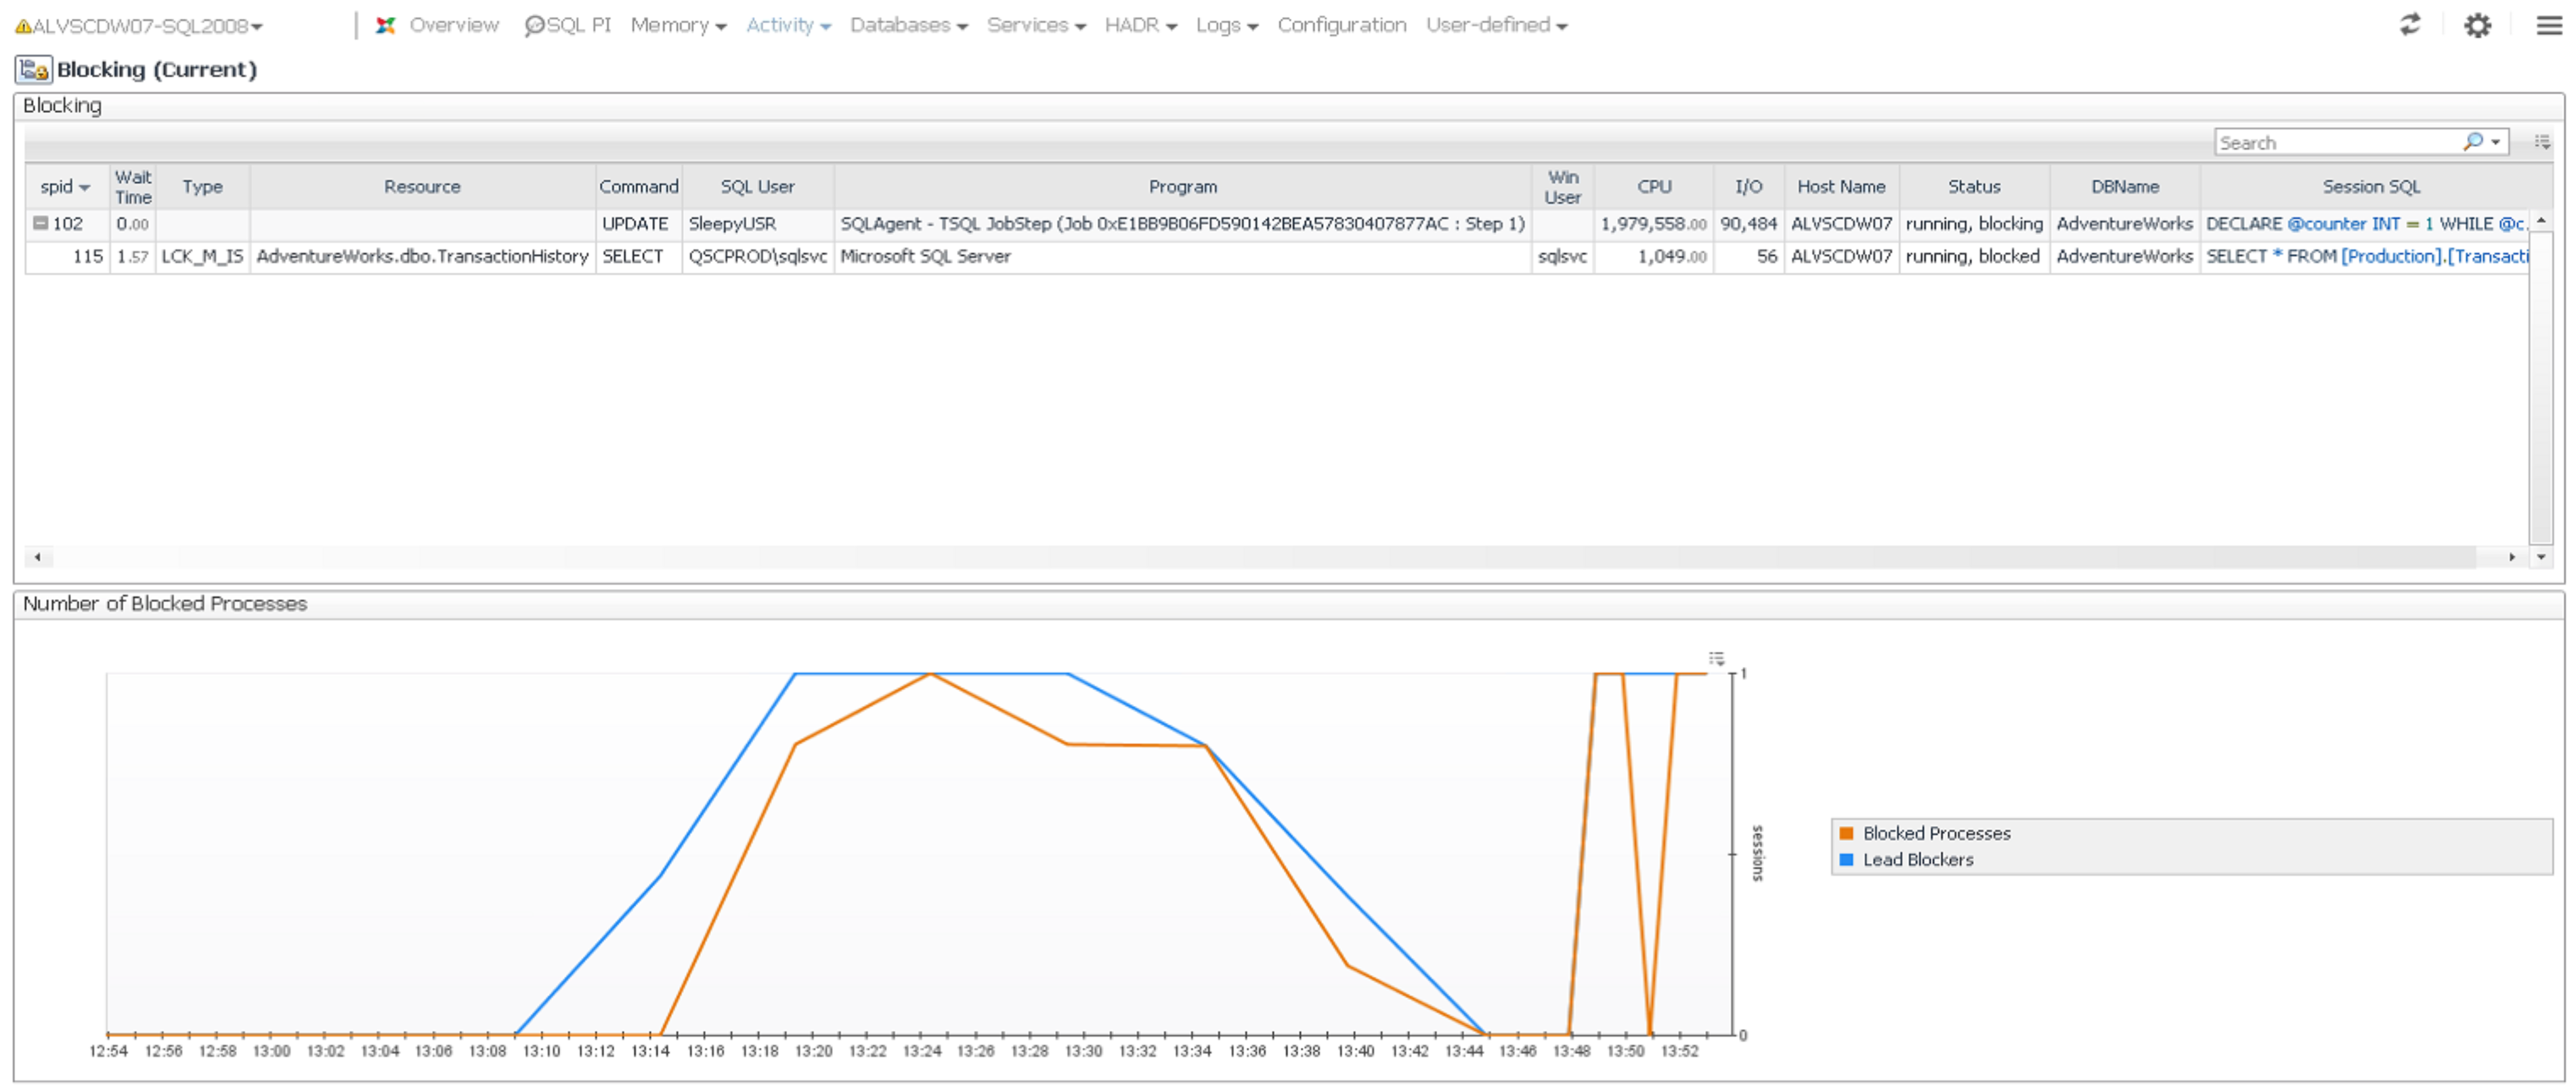
Clicking the “Investigate via Blocking dashboard” link will show you the session causing the block, and branching off from it below, the session(s) being blocked. For each session, you’ll see the User, Application (“Program”), machine name and SQL text.
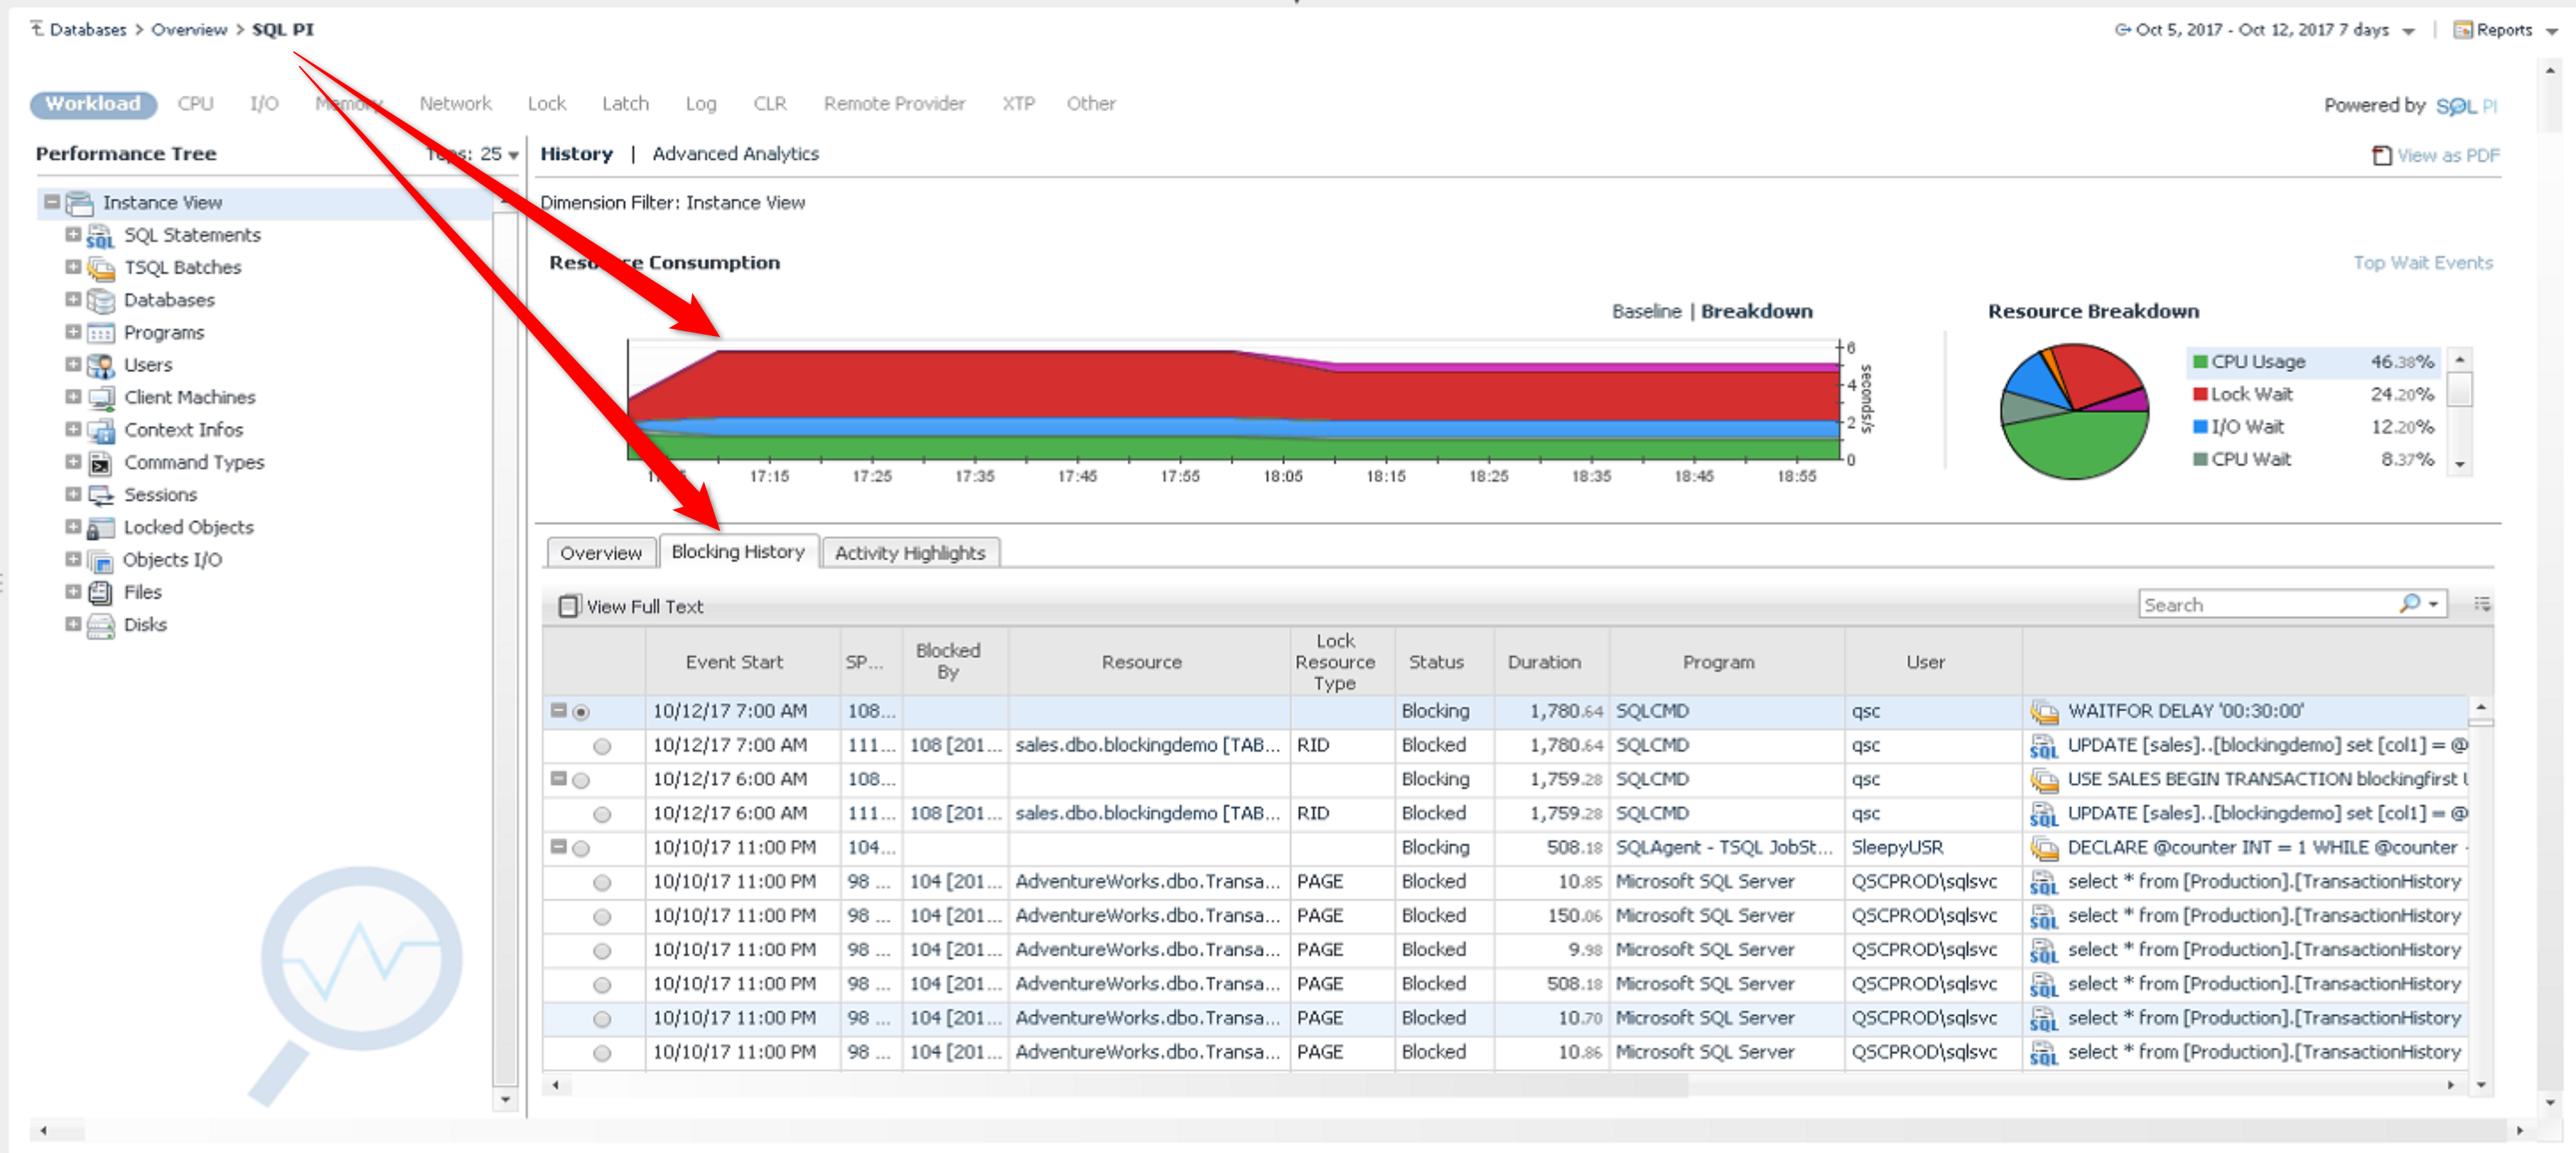
The Performance Investigator (“SQL PI”) section of Foglight can show you historical locking and blocking. Lock Waits show up in red in the breakdown chart, and if the locking resulting in blocking during the time you’re investigating, the Blocking History tab will show you blocking chains that occurred.
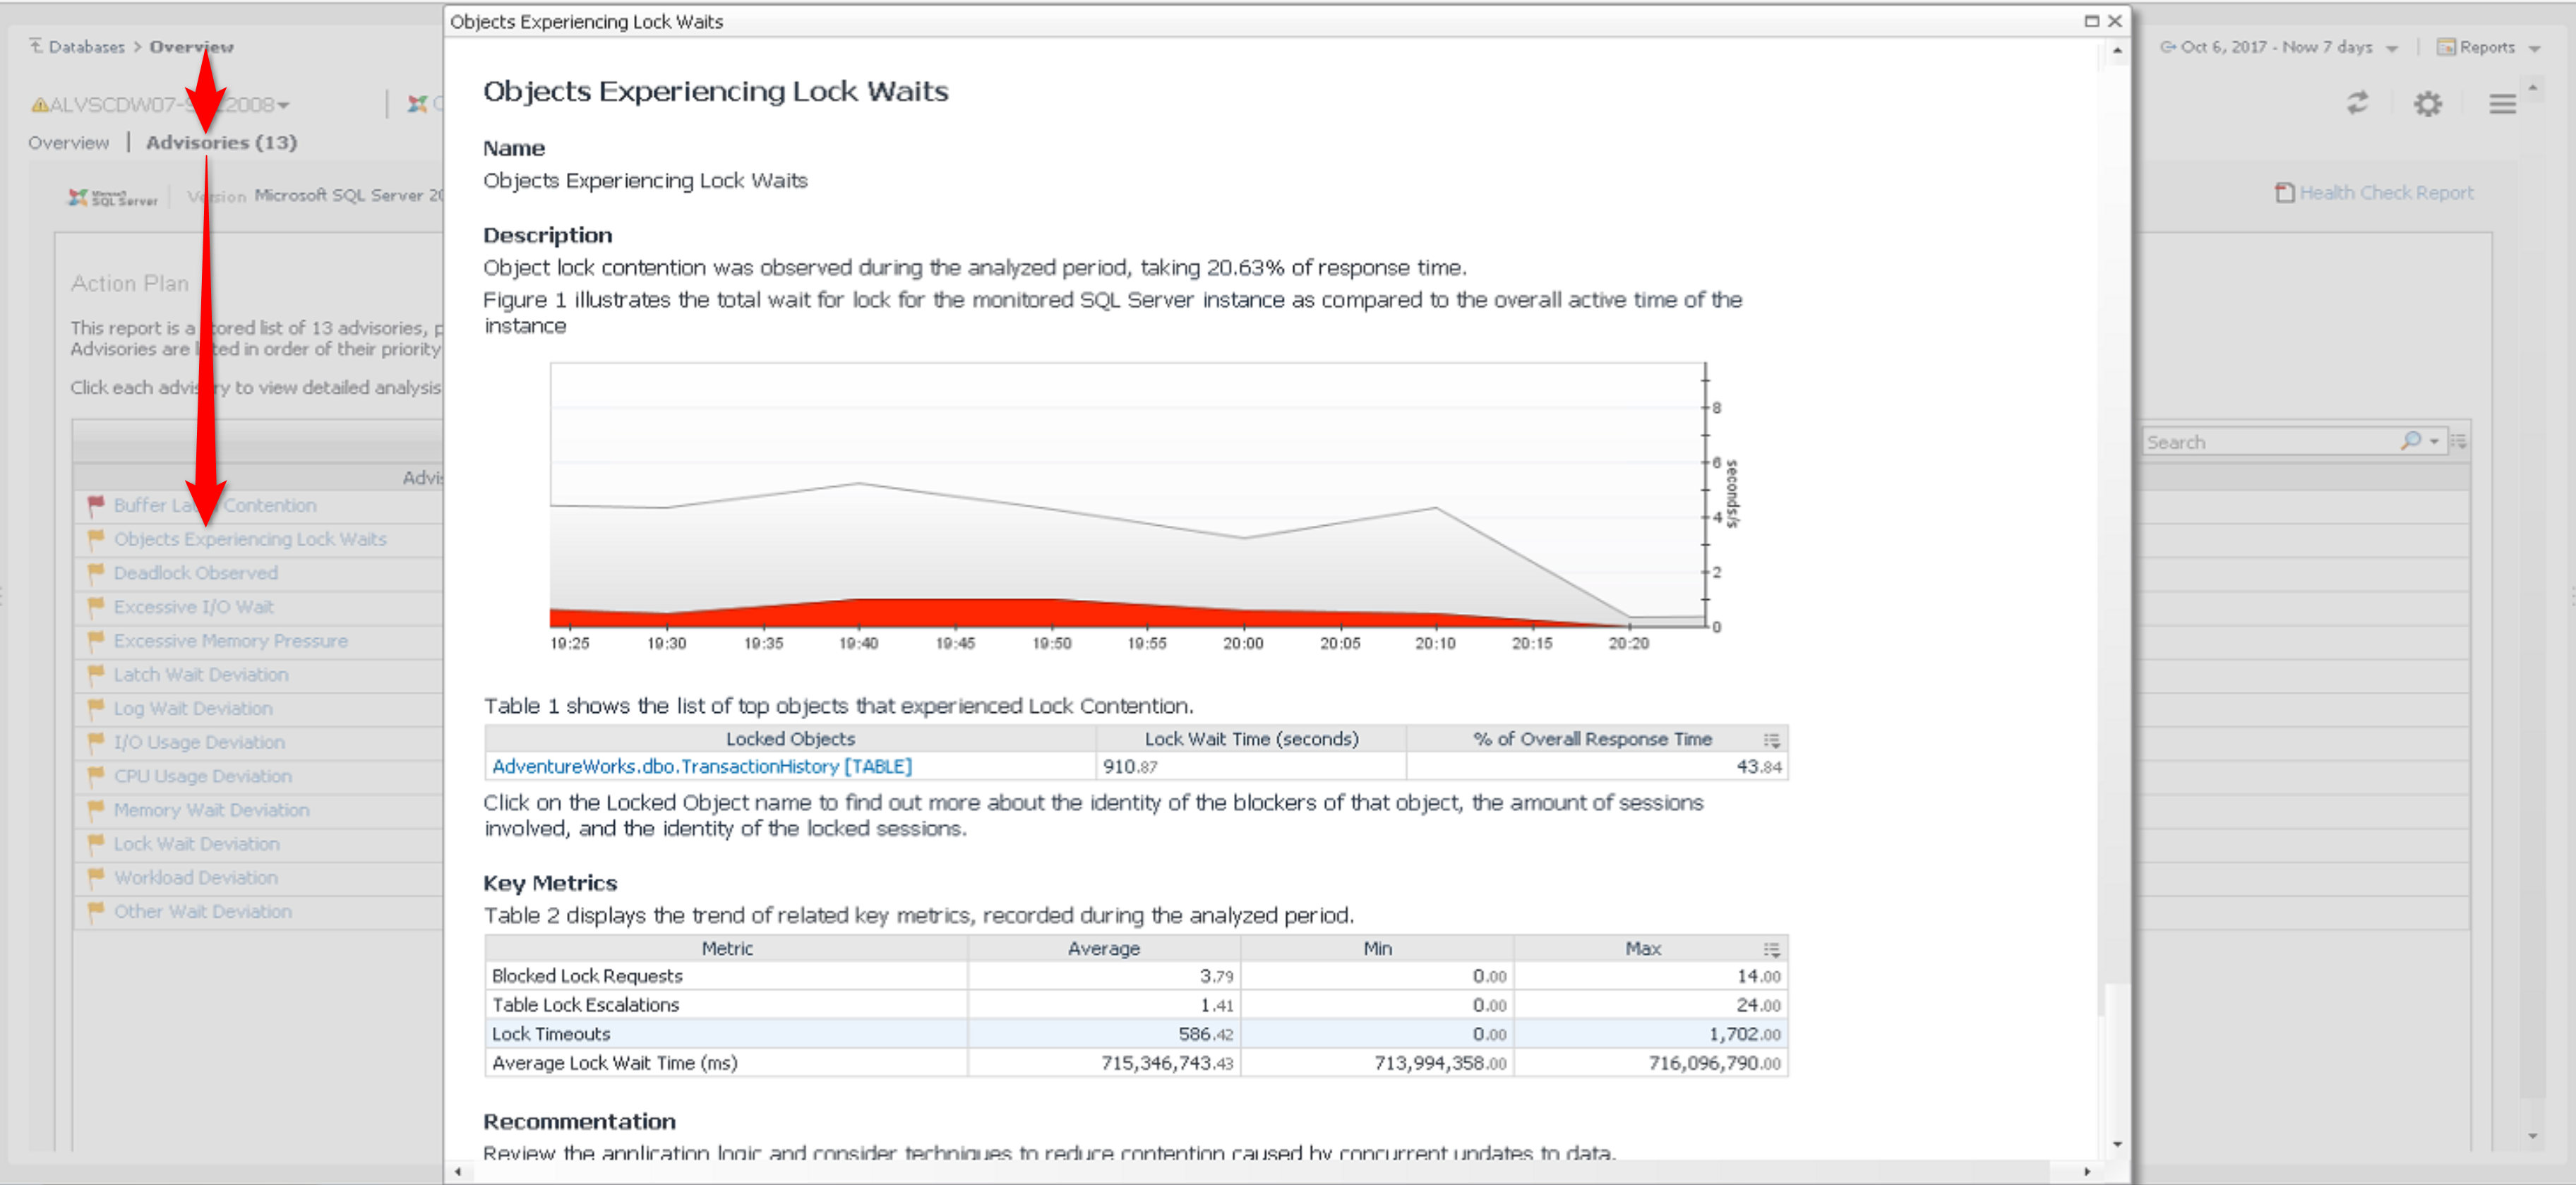
Lastly, Foglight can inform you about blocking with a Performance Advisory. If any Advisories have been generated for the time you’re investigating, you can see them by clicking on Advisories (next to Overiew in the upper left of the screen, as above. Performance Advisory are generated as often as once an hour, based on recent performance observations. In plain English, they’ll break the problem down to the causes, effected object and relevant metrics. You also get recommendations on how the address the issue and lots of helpful background information.
All of my Quest Database Performance blog posts can be found here.
