
Understanding the processes and configurations causing your bottlenecks
IO is the single most important metric to know for creating optimal performance of your database systems. To understand it, you’ll need to know the processes, resources and configurations involved. Here you’ll see how Foglight for Databases gives you a clear view of these in a few clicks.
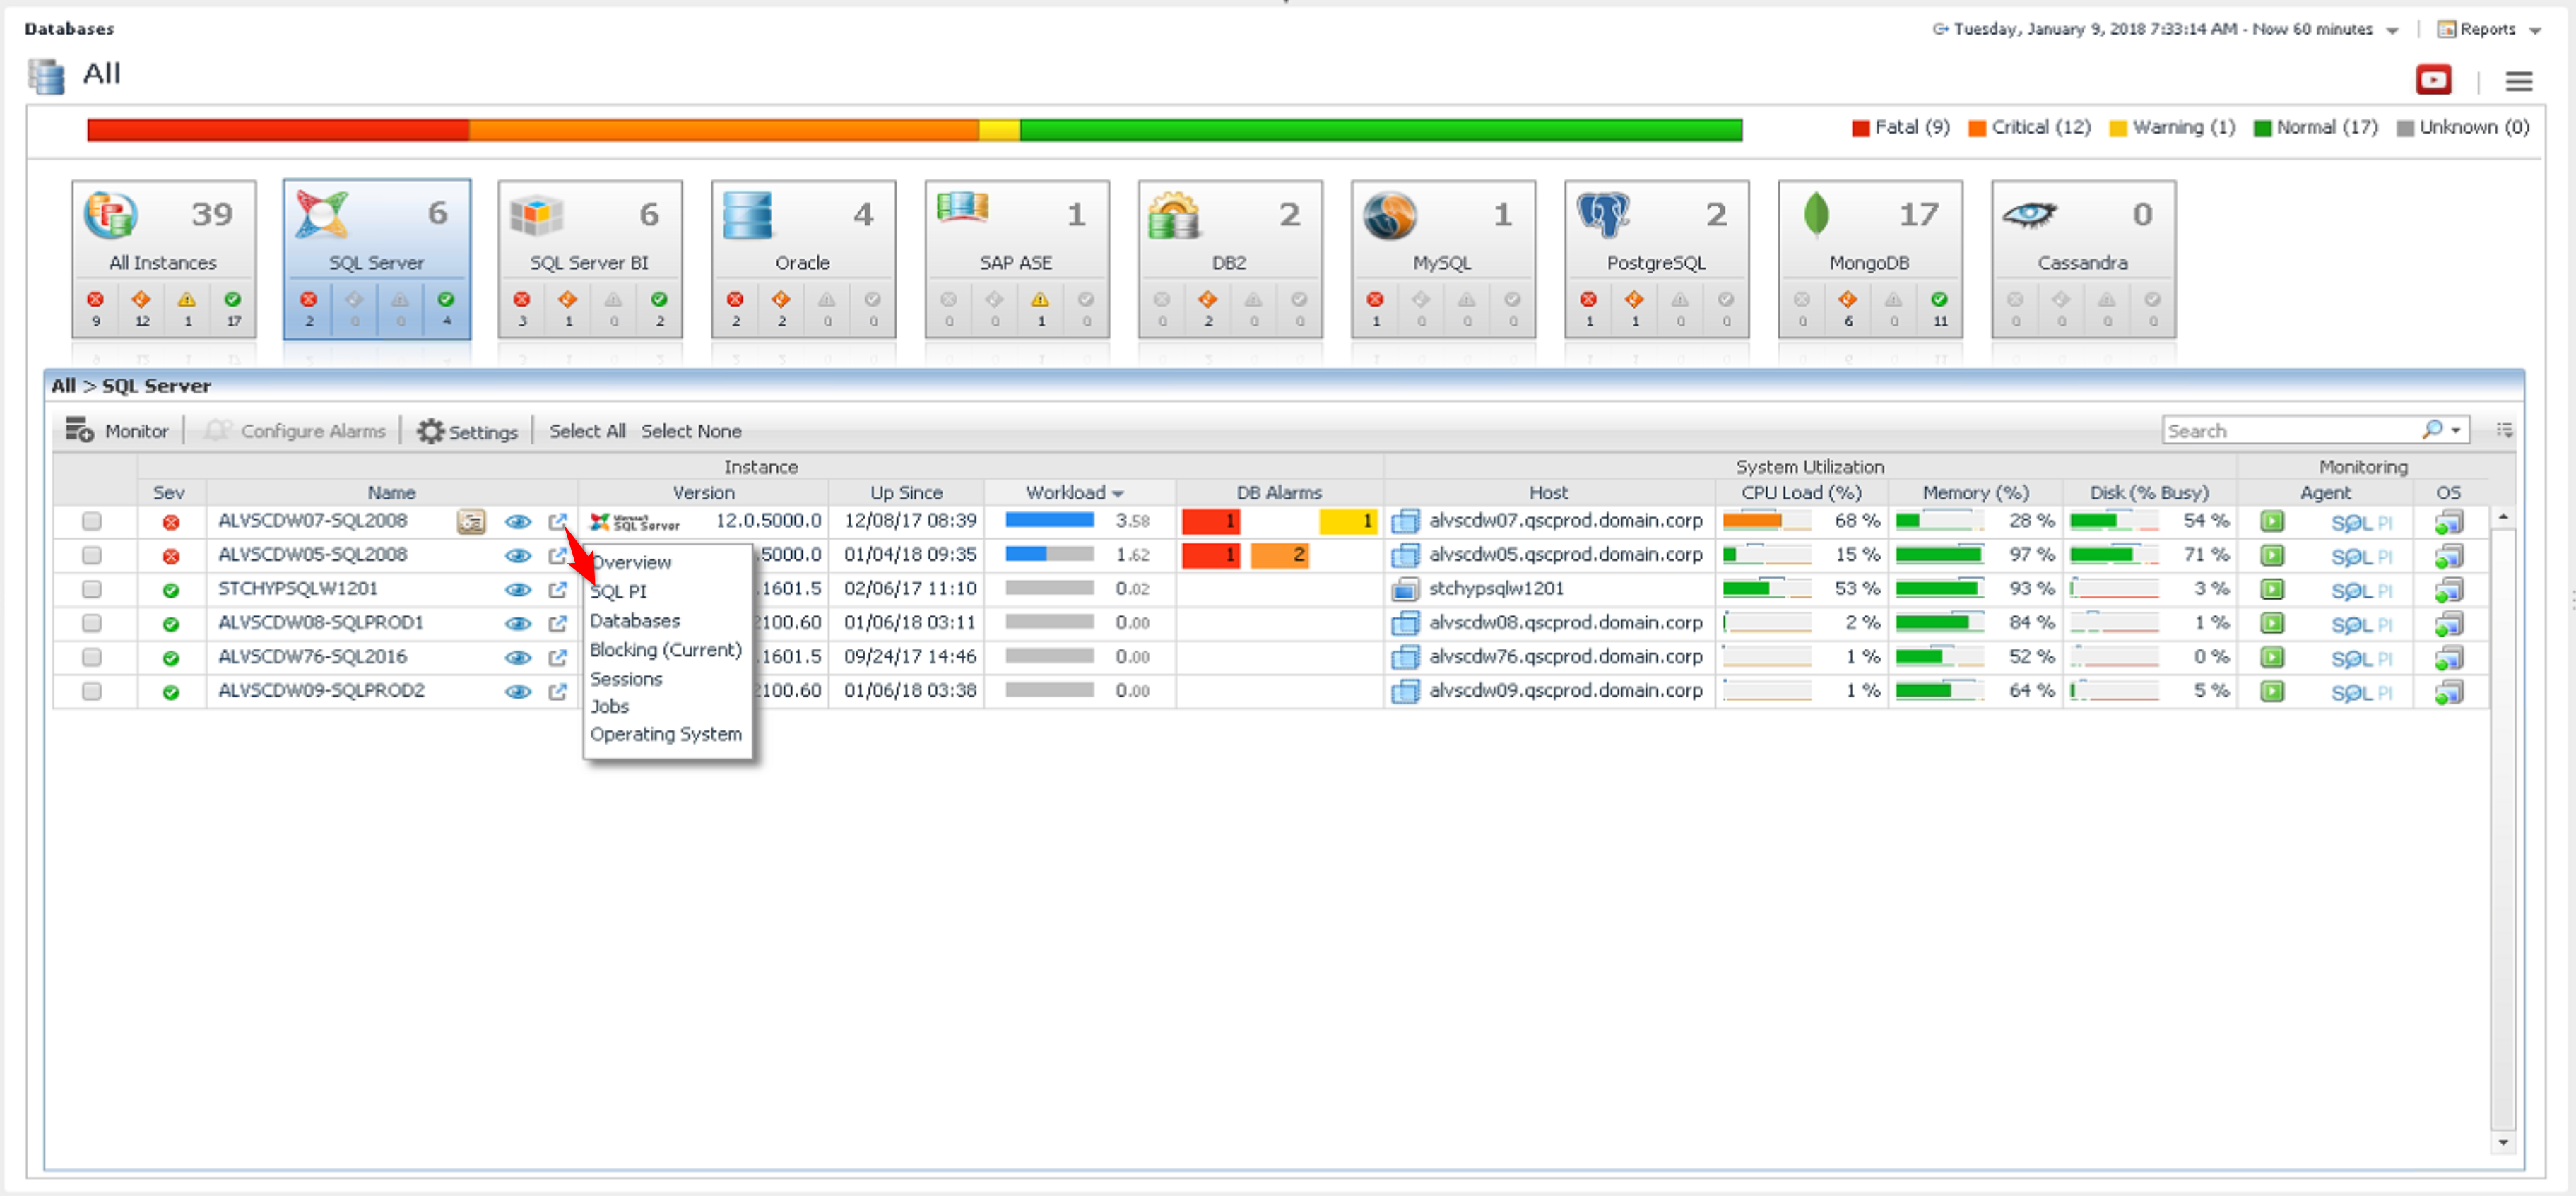
Foglight can alert you with an email when unusual IO load occurs, at which point you’ll want to navigate to SQL Performance Investigator (“SQL PI”) like this:
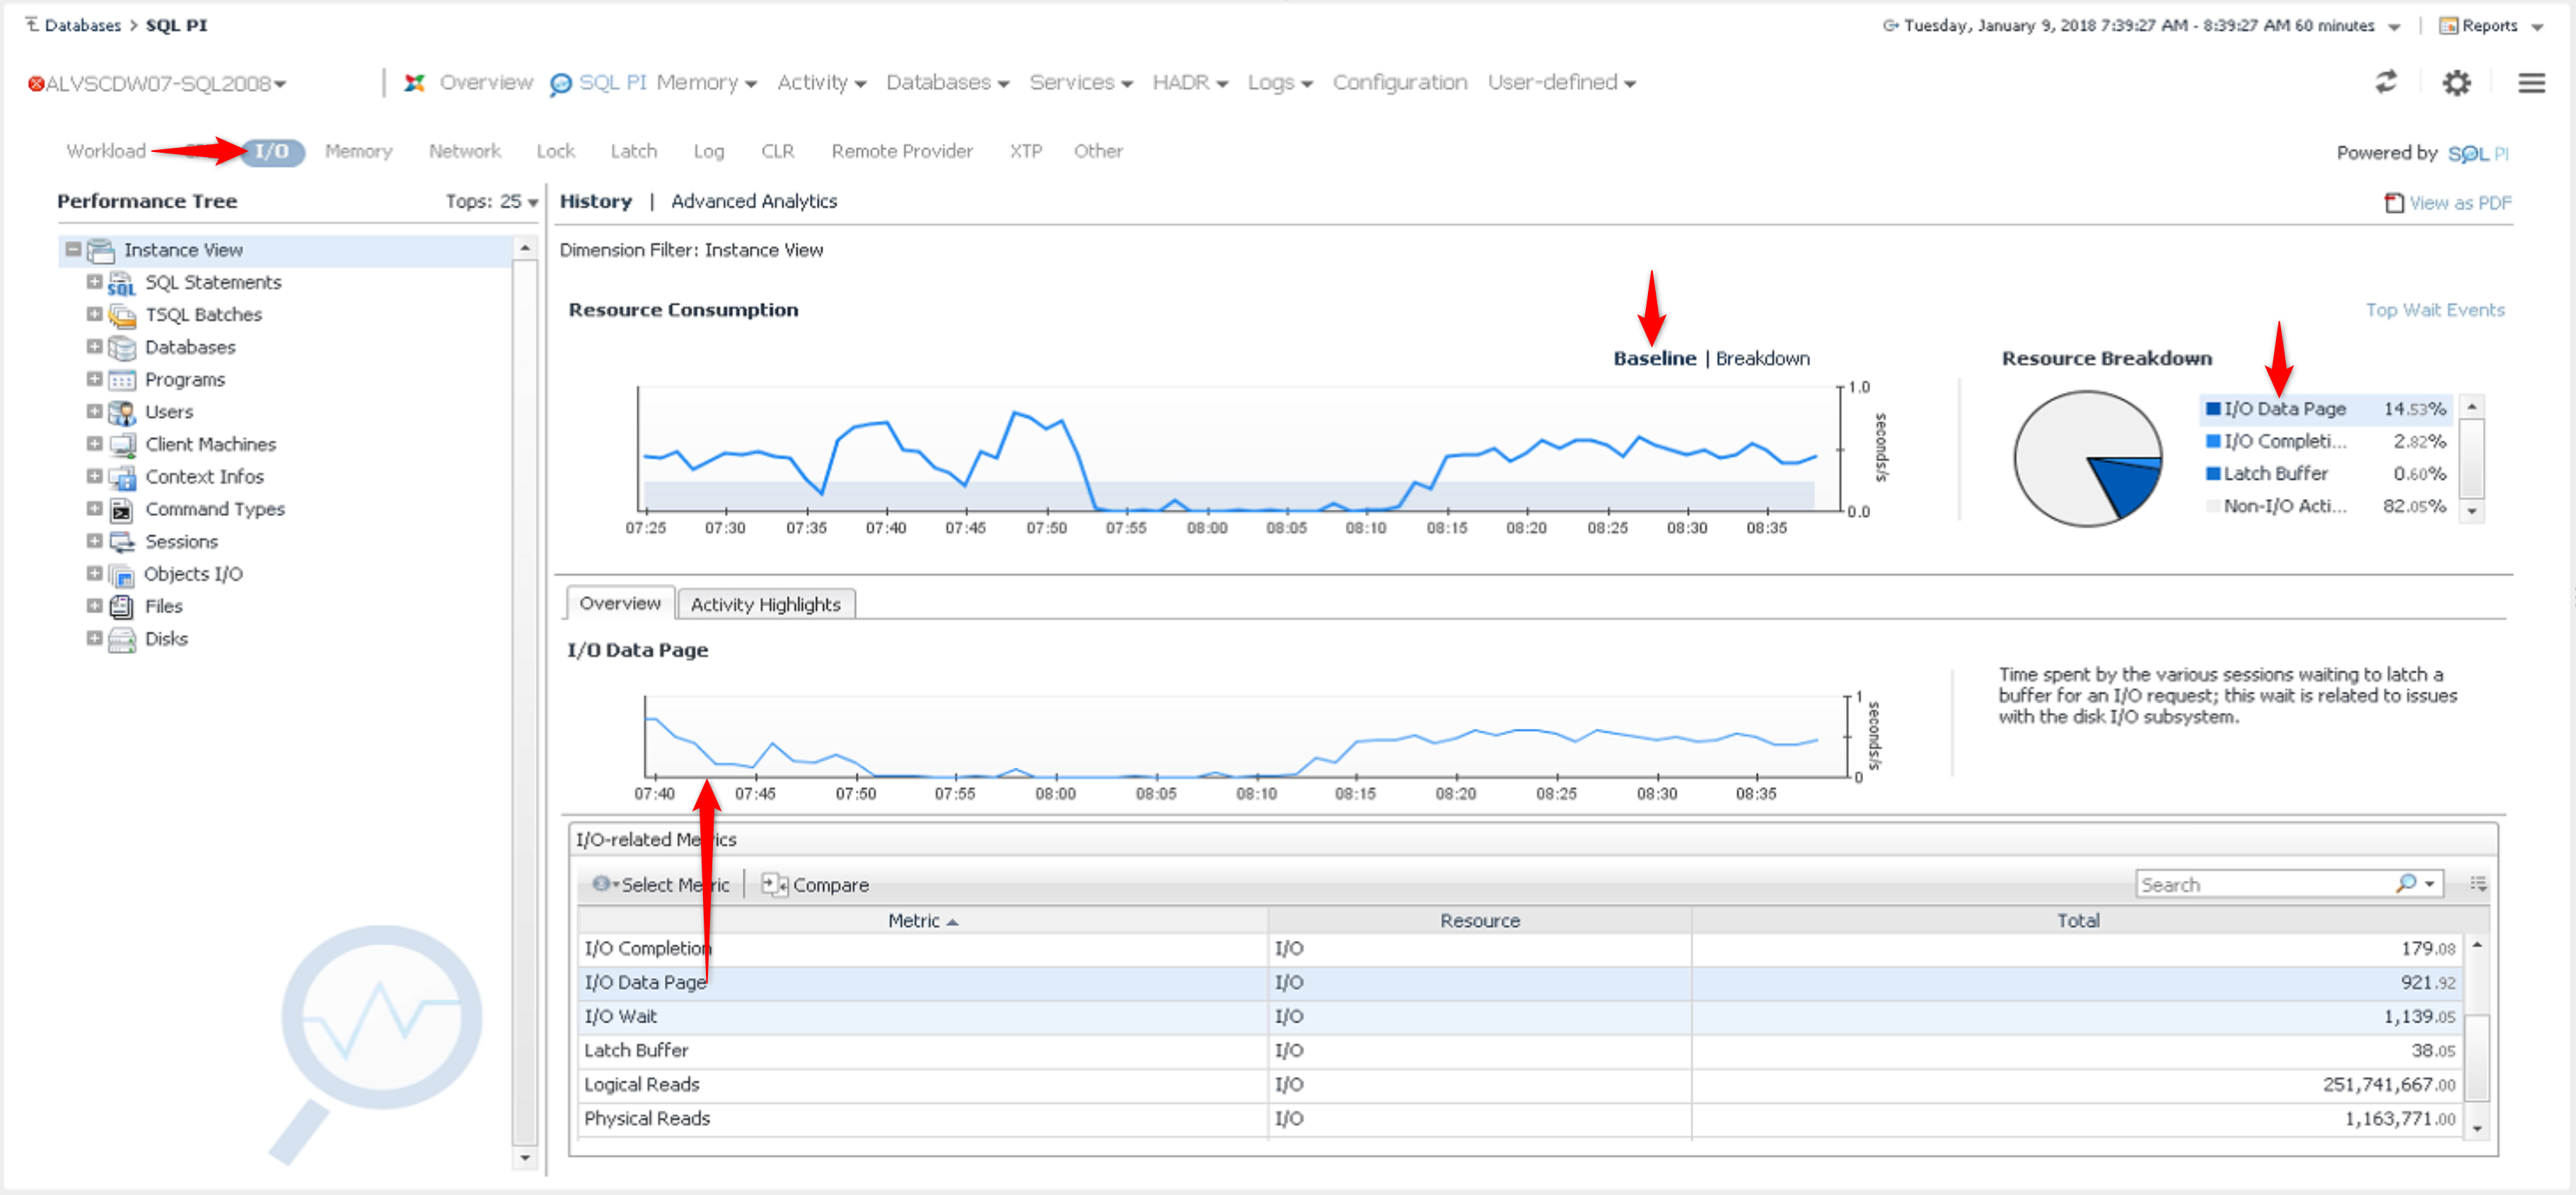
In the SQL PI interface, once you’ve selected the time range of interest (using the control in the upper-right corner) change the filter from “Workload” to “I/O” to see only IO-related activity. Also click on Baseline to how the IO activity deviated from the typical range. In the example below we can see that “I/O Data Page” was most prevalent operation, so if you’d like to track that specific metric during this time range, it can be selected from the table at the bottom of the screen and viewed in the lower graph:
Now that we’ve established that IO during a time range was unusual, we can figure out exactly what objects were hit with the load, and by which statements. Just click on the Objects dimension, and also click on the + sign to expand it. In the tree you’ll now see a list of objects, showing those hit with the most IO load at the top. The detail pain at the bottom of the screen shows the objects along with their IO load in seconds.
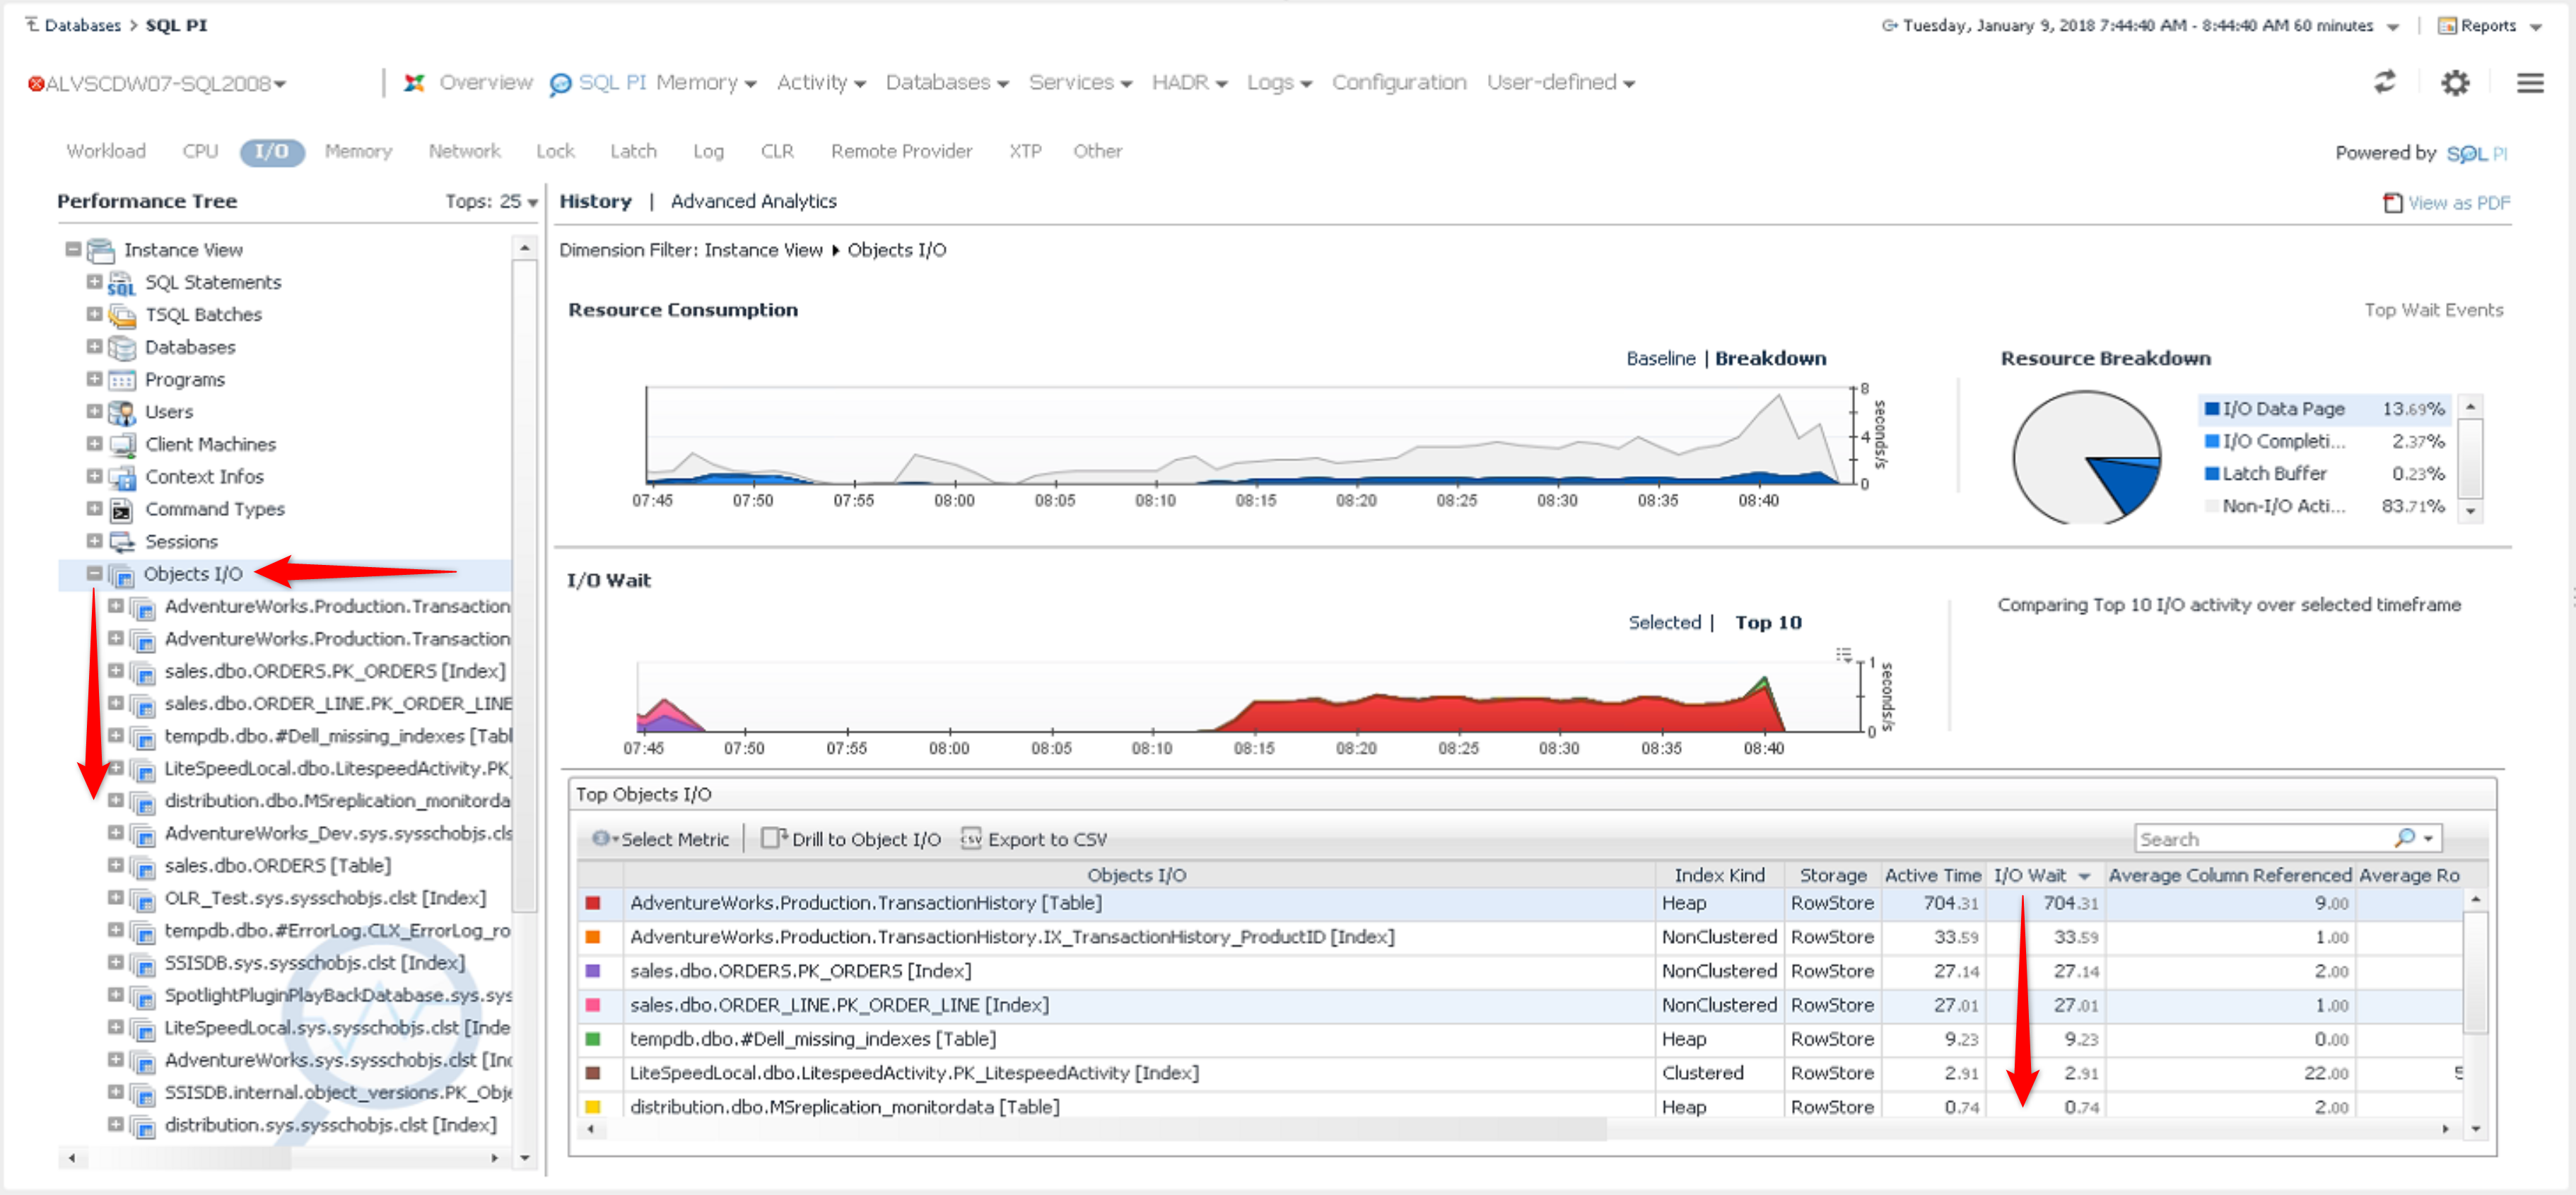
The Object at the very top is the one we’ll want to focus on, and we can learn more about it by expanding it with the + sign. Now we can look at the details of the activity on the object, such as the statements hitting it:
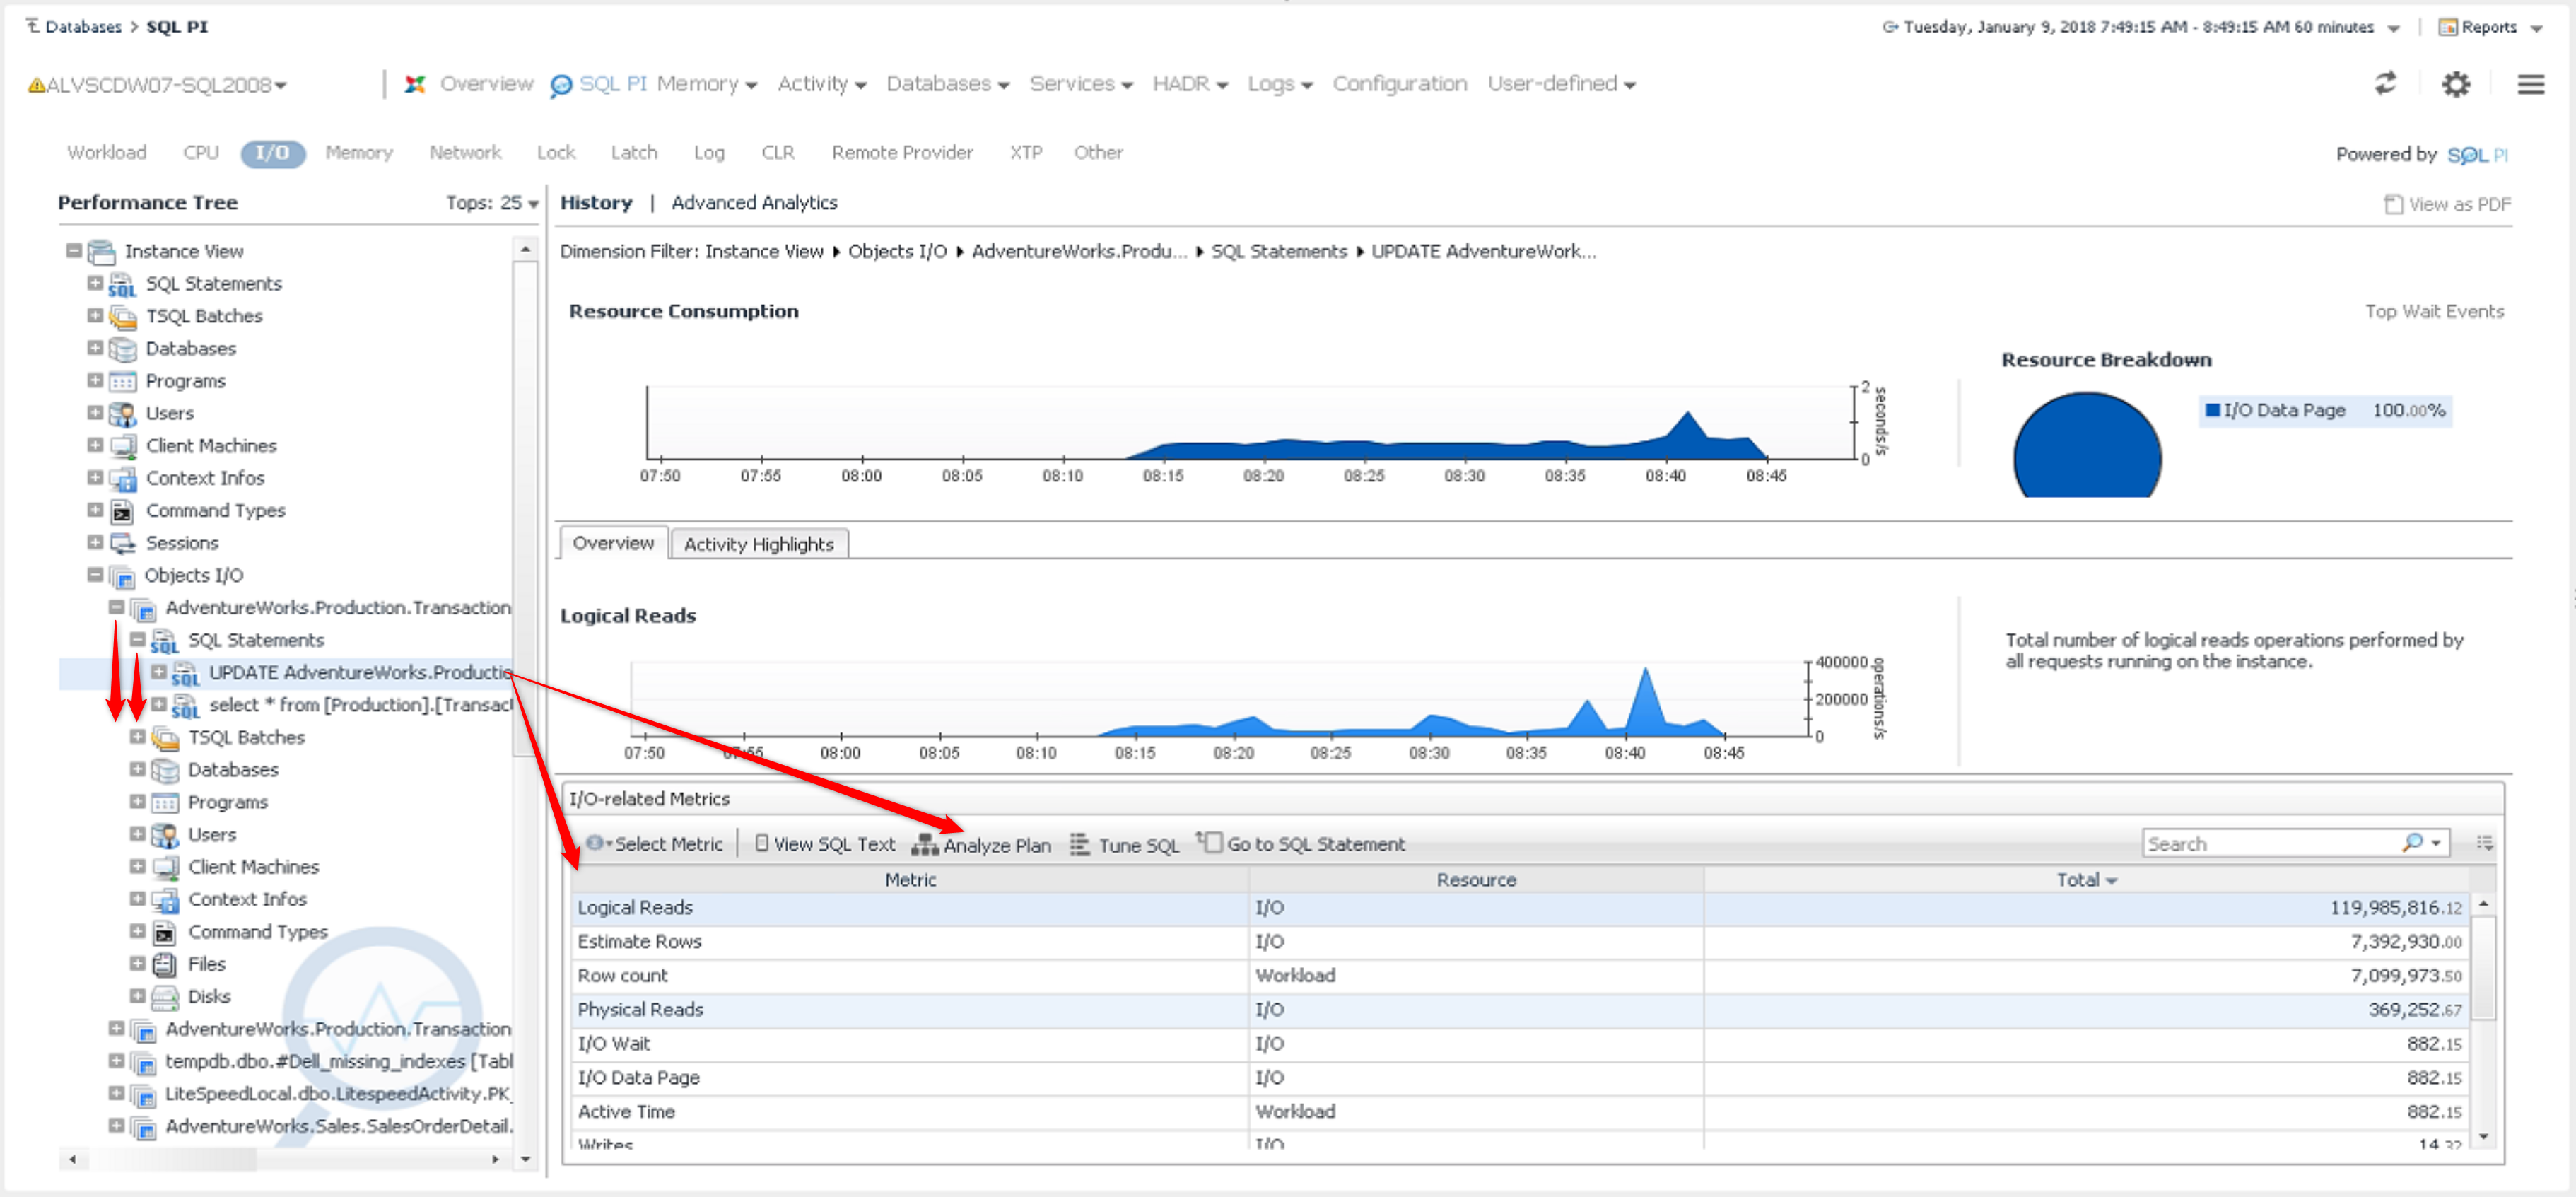
By clicking the top statement in the list, we can get details of its activity and view its text and execution plan.
So we’ve seen that after alerting us to unusual IO activity, Foglight can guide us through seeing what was unusual, the objects affected, the statements responsible, and their query plans. With this information, we can address the IO performance issue by making changes to hardware and/or configurations, or by optimizing with indexing or rewriting queries.
All of my Quest Database Performance blog posts can be found here.
