
Java Workload Characterization, understand your transaction Mix
Over the years, I have met, worked and learned from a number of experts in Performance Management field. These are professionals that are dedicating most or all of their times supporting large volume production systems, or are the consultants that customers go to, to get help from.
These Pros have taught me that deviations in the Workload and the Transaction Mix often degrades performance of a high volume production system. And the best way to deal with that is to first learn where your transactions are and what they do. This is called by some, the Workload Characterization. It is critical for high volume application environment. Simply, this is to understand the volume and average response time of key Transactions and Requests, during their normal daily activities, during peak period, and at month end and quarter end. So where do we begin with this? Typically I look at the Top Requests with the highest volume of executions, and look at their response time. How many different Request you need to look at, is a completely different topic. And you don’t need to go there, unless you are dealing with a very tough problem. I will publish that as a follow up to this in a separate Blog.
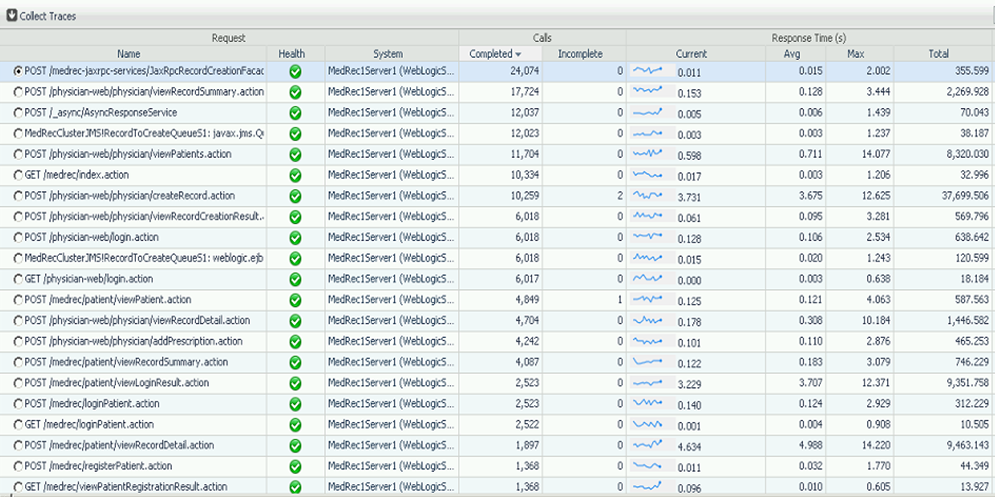
And to begin, for the first part, I suggest start getting ourselves familiar with the Top 5 Requests with the highest volumes. It is important to know which one of these Requests that we are going to focus on have good, bad or average response time. So I create the buckets for Volume and Response time, and I try to remember volume rankings, which is key. A lot of tools with Baselining and Intelligent Profiling make this easier to deal with. But you need to build a Heat Map for yourself. So you can see all the deviation in Volume Ranking and Average and Current Response time changes. That would tell you a lot. And will explain when no one has changed anything, but the application is performing very differently. Some people like to focus only on Business Critical Requests. I like to watch all high volume requests. Especially when there are a lot of different Requests types in the system, number of concurrent transactions goes up. So you need to watch the Request Rates also, and have a Heat Map for that. In the table below, I start looking at any Requests with a volume greater than 10,000. And I pick to focus on the Request with 3.675 second response time, assuming they are all equally important.
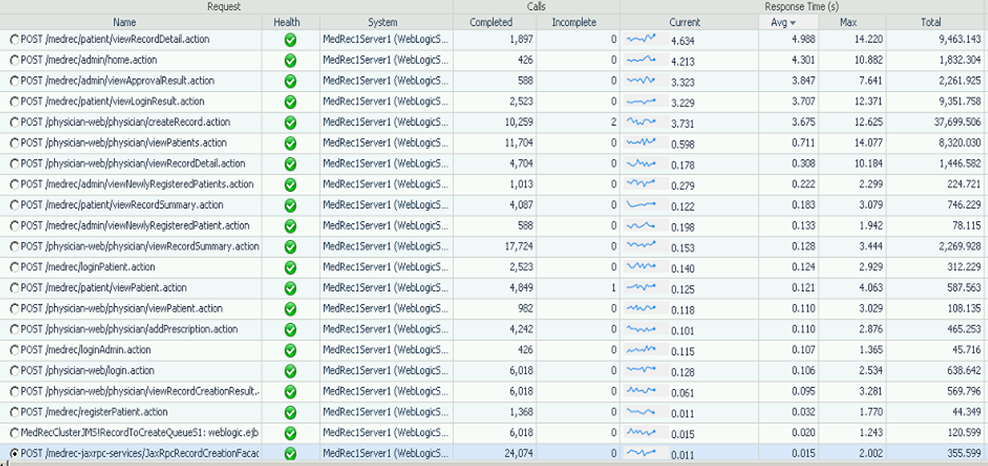
The second part of Workload Characterization is focusing on Response time as your primary sort field, instead of request execution count. So you sort everything with descending order of response time and identify the Requests with poor Average response time, and poor Current response time. And Request execution count is the secondary column to look at. And you end up working on the Request that has poor response time, and has high volume. In this second table I should focus on any Request that their response is greater than 3 seconds, again assuming they are all equally important requests for my application.
People extend and can have third, fourth and fifth triggers for Workload Characterization, for Requests that have finished Incomplete, or with High Max Response and ended with Exceptional Exits.
I have also seen people keeping track of Max to Average ratios for high volume and Critical Business Requests.
Please provide your feedback as I like to hear your perspectives. I always learn from my customers and peers.
