Congratulations! You have Foglight installed and it is collecting meaningful performance data. There’s no doubt it is providing a ‘smorgasbord’ of actionable information about your mission-critical environment. Help yourself to delicious servings of baseline data, proactive alerts, and custom dashboards and reports.
Now make room for dessert! Foglight is probably best known for its generous helping of PI. PI is an abbreviation for Performance Investigator. It’s a deep-dive query analysis utility that supports both SQL Server and Oracle and runs within the Foglight platform without requiring any agents to be installed on the monitored host. Don’t worry, it’s light-weight and easy on the configure. There won’t be too much on your plate.
For this example, it shows how to set-up PI for SQL Server but the steps for Oracle are the same.
**NOTE: It is important that you reference the Foglight Deployment Guide to understand the necessary resources required.
Here is the latest guide as of the publish date of this blog… -> https://support.quest.com/technical-documents/foglight-for-sql-server-cartridge-/5.7.5.50/deployment-guide.
See the ‘Hardware Requirements' section.
Here’s how to tell if it is already configured. Check to see if you have the PI logo on the Database Home Page. If you see the logo to the far right of the instance name, it’s configured. If you don’t see the logo, it’s not configured.
(Click on image to enlarge)

To configure PI, check the box to the left of the instance name. Settings > Administration
.
Choose SQL Performance Investigator.
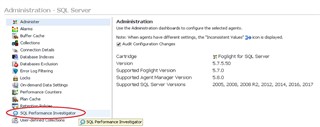
Performance Investigator requires a one-time single, embedded repository (built on a technology called Infobright) to hold the historical performance data (with 2 years of retention). So, from here, choose the ‘Attach SQL PI Repository’ button.

Note: The PI Repository can be set-up in a flexible/distributed fashion and installed on a different server than the one Foglight is installed on. If you want to do this, you’ll first need to install another Agent Manager. This blog explains how to install the Repository on the same server.
Again, this will be a one-time exercise. Additional configurations of PI for other monitored instances can use this repository and this step will be skipped. It will take a few minutes for the repository to install. Once you receive the message indicating a successful installation, check the box and choose the ‘Enable’ button (with the repository installed, the button will no longer be greyed out). Done!
Easy as…..PIE!
Now, let’s savor the goodness.
Go to the Database Home page, click on this icon ![]() and choose SQL PI.
and choose SQL PI.

*Again, if PI is configured correctly, you will see a SQL PI icon to the far right of the SQL instance name in the Monitoring Agent column.
You will see the Performance Investigator (PI) page like this… (Try not to drool on your keyboard.)
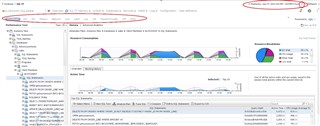
Per the circled items above...
Step 1: Choose your resource to investigate.
Step 2: Choose the timeframe you want to view.
Step 3: Use the Navigation Tree on the left side to drill into the various data elements.
Any palate will enjoy these tasty features….
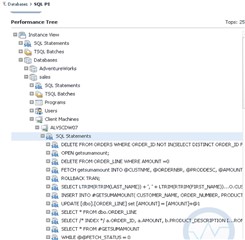
Dimension Drilldowns – Easily find SQL bottlenecks by various data dimensions in the tree…by database, by application…perhaps find that particular user running that CPU-intensive query…
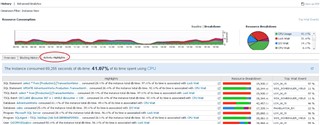
Activity Highlights - If the Dimension Tree isn’t easy enough, PI will highlight the activity that you might want to focus on first…this application, this user and so on.
Change Tracking – Foglight tracks several change events. You can quickly see if someone dropped that critical index. Or, wouldn’t it be useful to know if someone altered permissions?
There are more details on Change Tracking in this blog here -> https://www.quest.com/community/quest/performance-monitoring/b/performance-monitoring-blog/posts/ch-ch-ch-ch-changes--david-bowie
![]()
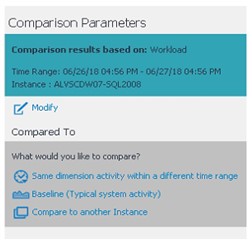
Comparison Utility – It was fine at this time yesterday, what’s different causing performance to have taken a nose dive today? Maybe it’s a user on the system today running a Select * who wasn’t yesterday…or maybe it’s simply a difference in database configuration parameters. Compare side by side to identify that.


Getting hungry?
There’s always room for dessert.
For more information, visit Foglight database monitoring and order up a free trial.


