
Foglight for SQL Server Business Intelligence (BI) provides analysis monitoring for SQL Server BI services: Integration Services, Reporting Services, and Analysis Services.
In this (Part 1) blog, the focus is SQL Server Integration Services or ‘SSIS’.
SSIS is a component of SQL Server designed to assist with data migration and integration. It can be leveraged in a number of ways and all of them can be critical to running smooth and effective business operations. Its primary function is Data Transformation, ‘ETL’ – Extract, Transform, and Load. Though some DBAs are only tasked with administering the SQL Server engine, others are stretched to also manage the BI installations. These DBAs may need to export data to archive, move data from sources to targets, ‘clean’/transform data, and load/import new data. All of this is done to ensure the business is not using or reporting dated or inaccurate data.
This blog reviews 1. the permissions needed to monitor, 2. the steps to configure an instance to monitor, and 3. the metrics and alarms provided in the various dashboards.
Note: For more details than what is covered in this blog, search/reference the Foglight for SQL Server User Guide
Permissions:
The SQL Server database engine monitor user and the Integration services monitor user must be the same.
The login ID used to monitor the Integration Service must be a user on the SSISDB database.
The ID used to monitor the Integration Services on the database needs to have the ssis_admin role, (needed for collections).
Configuration:
You must register the SQL Server instance hosting the integration databases first before configuring the SSIS monitoring. Then, once Foglight is monitoring the instance, you need only supply the server credentials.
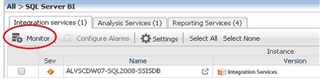
Choose the ‘Monitor’ button and select the instance from the list.
The default name of an Integration Service agent is <Instance name>_<Repository name>. The repository name for SSIS is SSISDB.
.
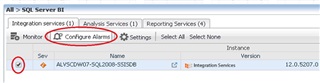
From the Databases dashboard, choose the SQL Server BI tile, then click on the Integration services tab.
*(Click on the image to enlarge)
The Database home page displays the Instance name, version, last restart, the number and severity (color) of alarms firing against it, and system utilization counters.
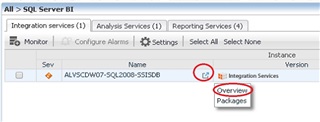
To the right of the instance name, click on this icon 
It displays two drill-down options: Overview and Packages
Overview dashboard:
Select Overview.
Across the top in a grey bar, you’ll see…

…the schema build of the SSIS catalog, its schema version, the retention window (equals the number of days logged operations data is kept in the catalog database before deletion), the logging level default used for running the packages, the encryption algorithm level used to store the packages’ XML ‘scripts’, the hostname, and OS version.
The Overview dashboard displays a series of categorized tiles with pertinent metric data and any associated alarms.
Availability state
High Availability/Disaster Recovery (HA/DR) states
Storage displays the space utilization level for the disk with the least free space on the server and the catalog database utilization level.
Infrastructure shows information for the server and the service including....
CPU utilization of the Integration service.
Memory used by the Integration service
Disk Latency of the slowest disk on the server.
*(High I/O value might lead to low IO rate for the running ETL packages.)
Network utilization/pressure experienced by the server
The Operational tile is a summary of the packages' execution state over time including the number of failed and successful executions (and other states).
The Performance tile trends the rows read and written and displays the number of packages run and running.
The Alarms Panel (on the right side of the dashboard) displays relevant alarms. These can be sorted by Time or Severity.
Packages dashboard:
Or, if you’re already on the Overview dashboard, to view the Packages dashboard,
Click on the Packages tab.
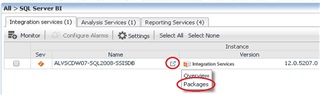
Or you’re on the Database home page, to the right of the instance name,
Click on this icon 
Select Packages.
Either way, you then see this…
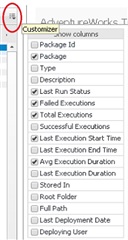
Note the options to Show / Sort By / Order
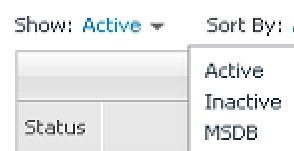
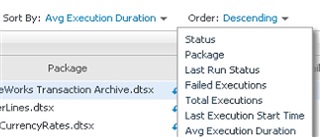
Additional columns are available to view as well…
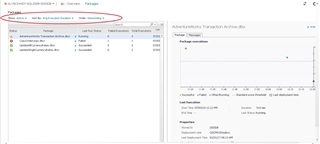
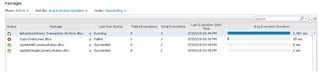
Collected from the catalog logs, the left pane of the Packages dashboard lists package activity during a specified time range. Users can identify active/inactive executions, failures, and long-running executions.
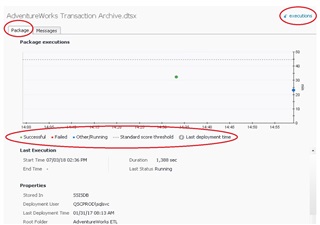
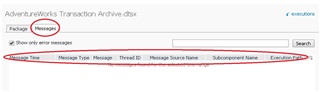
The right pane / Package tab displays execution/step trends and a color-coded status. Users can view and search (via search field) relevant information in the log via the Messages tab.
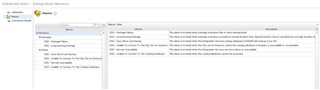
To view the Alarms available in Foglight for SSIS, from the Database Home page, check the box to the left of the instance and choose the Configure Alarms button.
For more information, visit Foglight database monitoring to download a free trial.
-

chrisjonson223
over 1 year ago
-
Cancel
-
Up
0
Down
-
-
Reply
-
More
-
Cancel
Comment-

chrisjonson223
over 1 year ago
-
Cancel
-
Up
0
Down
-
-
Reply
-
More
-
Cancel
Children