
Foglight for SQL Server Business Intelligence (BI) provides analysis monitoring for SQL Server BI services: Integration Services, Reporting Services, and Analysis Services.
In this (Part 2) blog, the focus is SQL Server Reporting Services or ‘SSRS’.
SSRS is the business reporting component in the Microsoft BI stack. This server-based component allows users to build, view, deliver, and present reports.
This blog reviews 1. the permissions needed to monitor, 2. the steps to configure an instance to monitor, and 3. the metrics and alarms provided in the various dashboards. *For more details, reference the Foglight for SQL Server User Guide.
Permissions:
The SQL Server database engine monitor user and the Reporting services monitor user must be the same.
No additional permissions are required to monitor Reporting Services.
Configuration:
You must register the SQL Server instance hosting the Reporting databases first before configuring the SSRS monitoring. Then, once Foglight is monitoring the instance, you need only supply the server credentials.
Choose the ‘Monitor’ button and select the instance from the list.
*(Click on the image to enlarge)
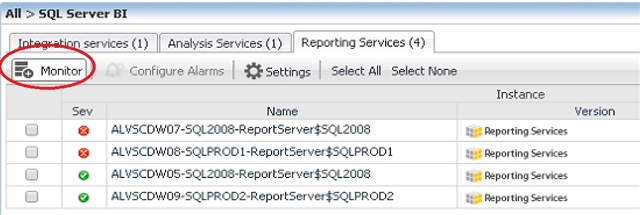
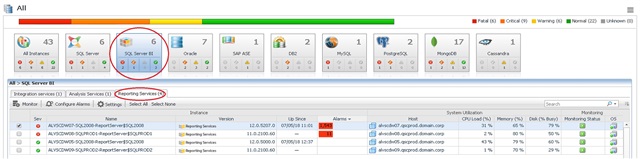
From the Databases dashboard, choose the SQL Server BI tile, then click on the Reporting services tab.
The Database home page displays the Instance name, version, last restart, the number and severity (color) of alarms firing against it, and system utilization counters.
Click on the Instance name
Monitor Reports: Foglight for SQL Server can analyze the metadata stored in the SQL Server instance and generate Activity reports.
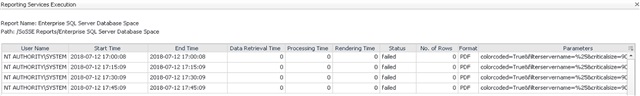
Across the middle, you’ll see the Reporting Services Execution Summary table with a row per report.
Users can view the path where the report resides, the report name, a report status (Running, Success, or Failed), data retrieval time, data rendering time, the total rows contained in the report, and the number of report executions.
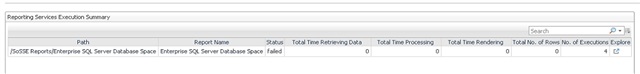
The last option to the far right of the table is labeled Explore…
……accesses additional information about the report including the user who ran the report, its start and end times, the report format, and included parameters.
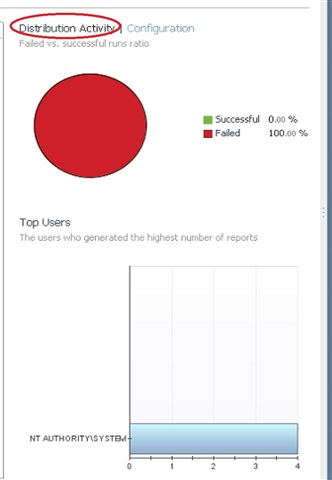
On the right side, choose the ‘Distribution Activity’ option to view the Run Distribution (Successful vs Failed) illustrated with a pie chart.
Below it, a bar graph displays the users generating the most reports.
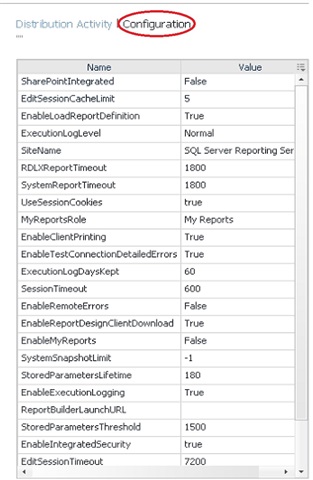
Choose the ‘Configuration’ option to see the parameters.
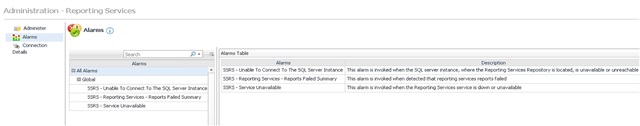
To view the Alarms available in Foglight for SSRS, from the Database Home page, check the box to the left of the instance and choose the Configure Alarms button.
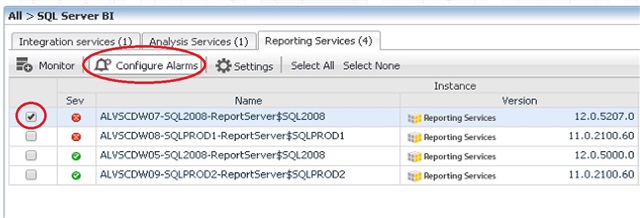
Available SSRS Alarms:
Monitoring SSRS with Foglight allows users to keep track of mission-critical reports and understand if the reports are executing successfully and efficiently.
For more information, visit Foglight database monitoring to download a free trial.
