
A Brief Walk-Through of SQL Performance Investigator
In a previous Foglight for Databases/SQL Server blog post, I provided a guide for navigating your database servers’ performance metrics in real-time. That post showed you how to identify your SQL Servers’ current problem areas and then quickly understand the related statements, effected objects and/or root causes.
This post will focus on the part of Foglight used to investigate SQL workload history. SQL Performance Investigator (“SQL PI”) enables you to look back over the history of your database Server’s workload and see how much of each resource was used by precisely which statements, along with lots of other context and detail.
We’ll use SQL Server for this example, but the same functionality you’ll see below is also available for Oracle.
The Basic Foglight SQL PI Workflows
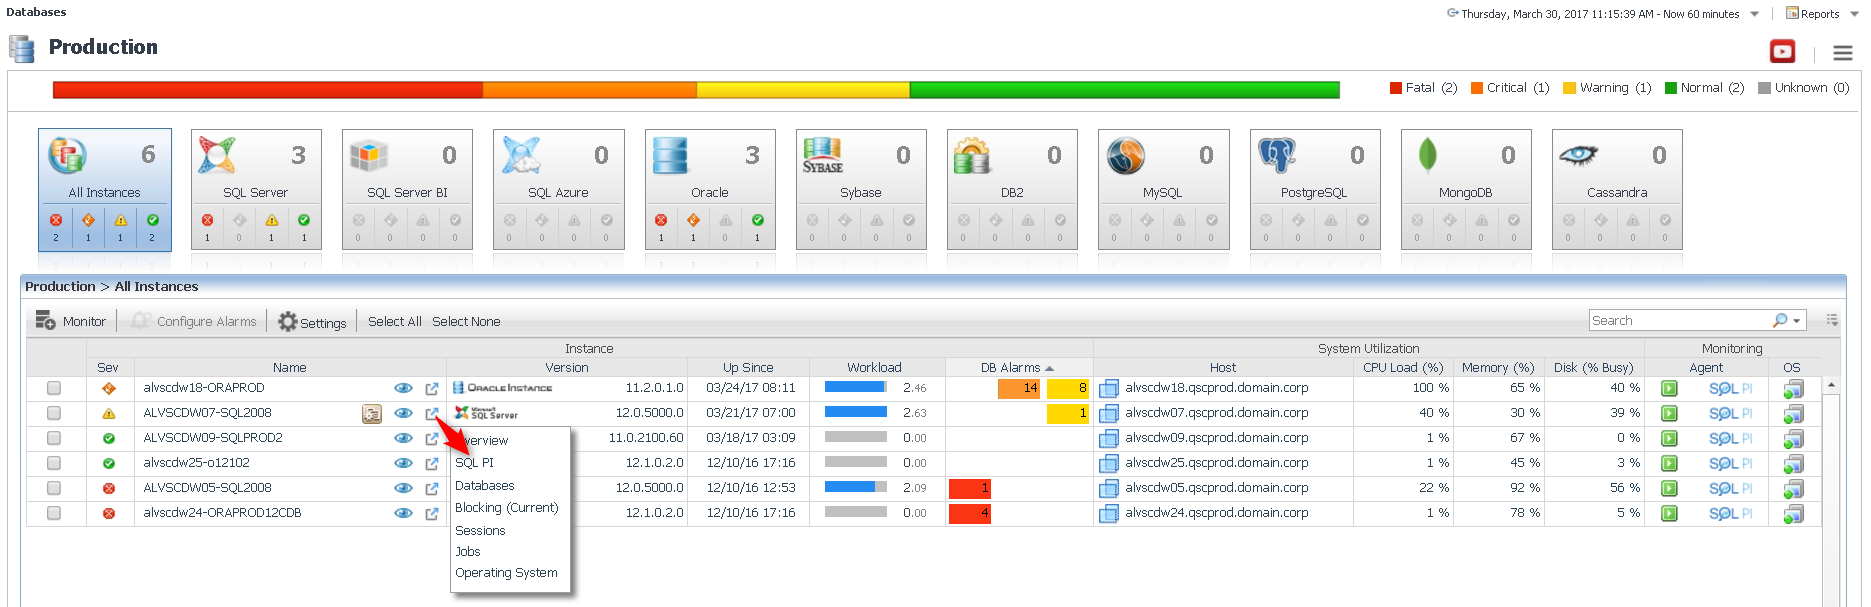
The quickest way to get to SQL PI is to click on the shortcut icon and choose SQL PI.
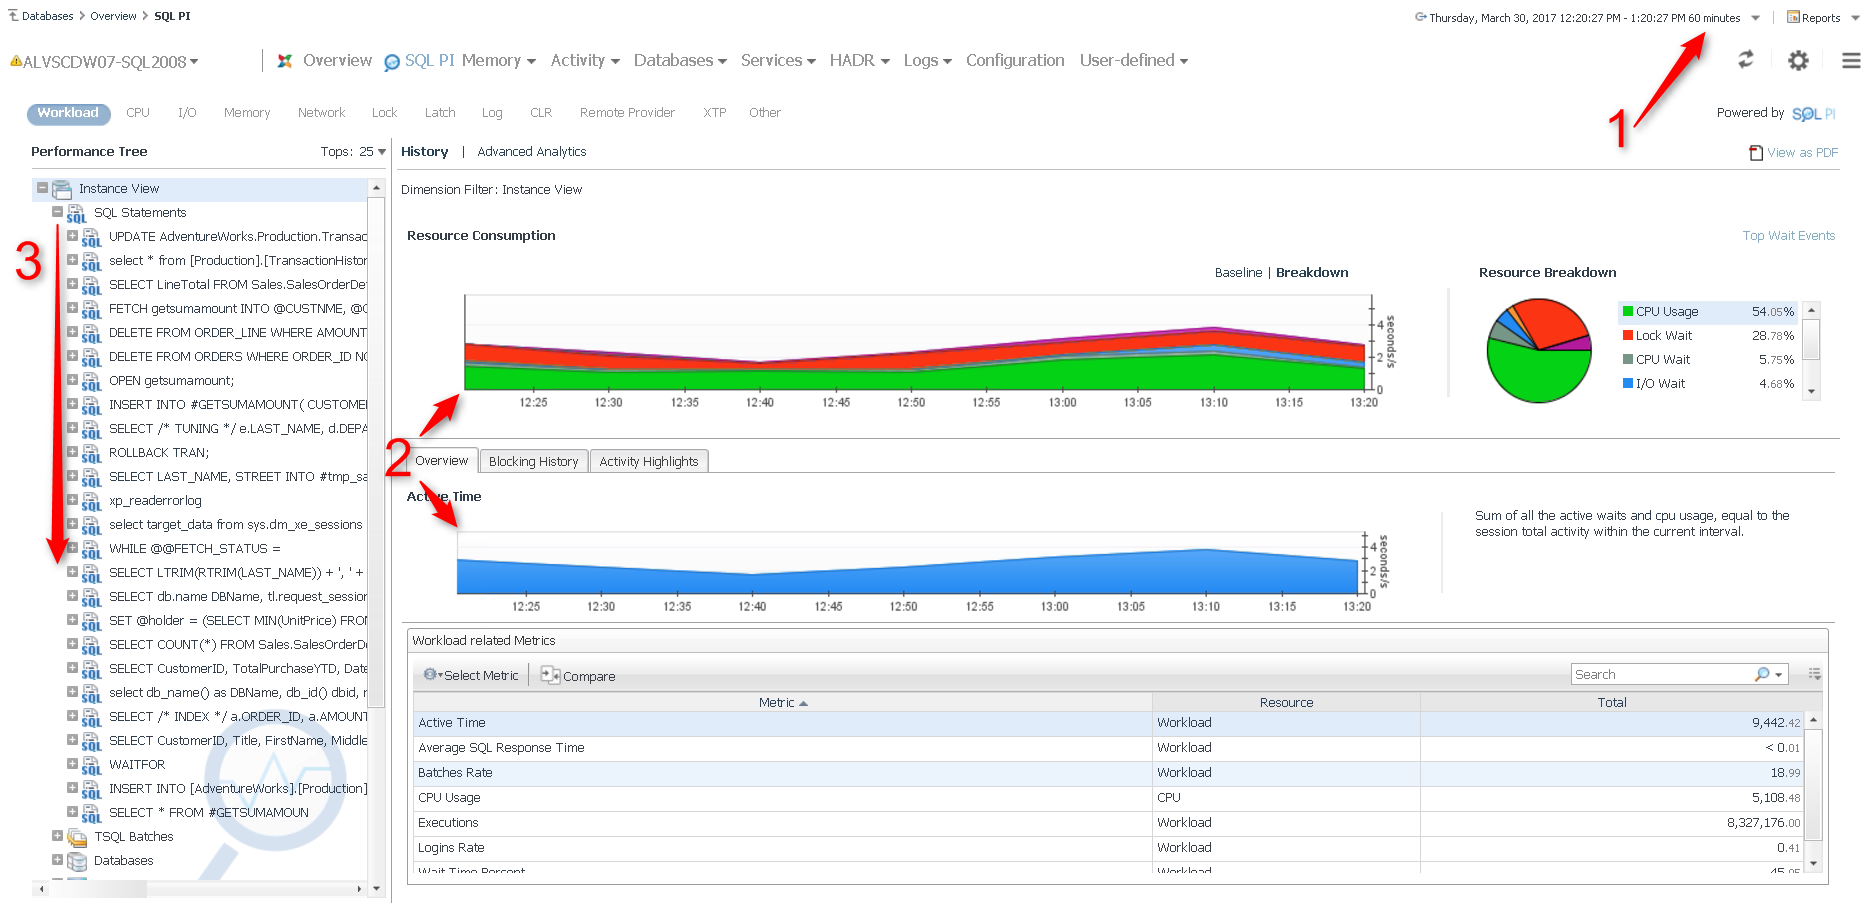
A simple PI example involves just three steps: (1) choose the time range that you would like to investigate, (2) view the timelines showing you the workload and metrics observed, and (3) expand the SQL Statements dimension to see the statements, in descending order from heaviest to lightest, that created that workload.
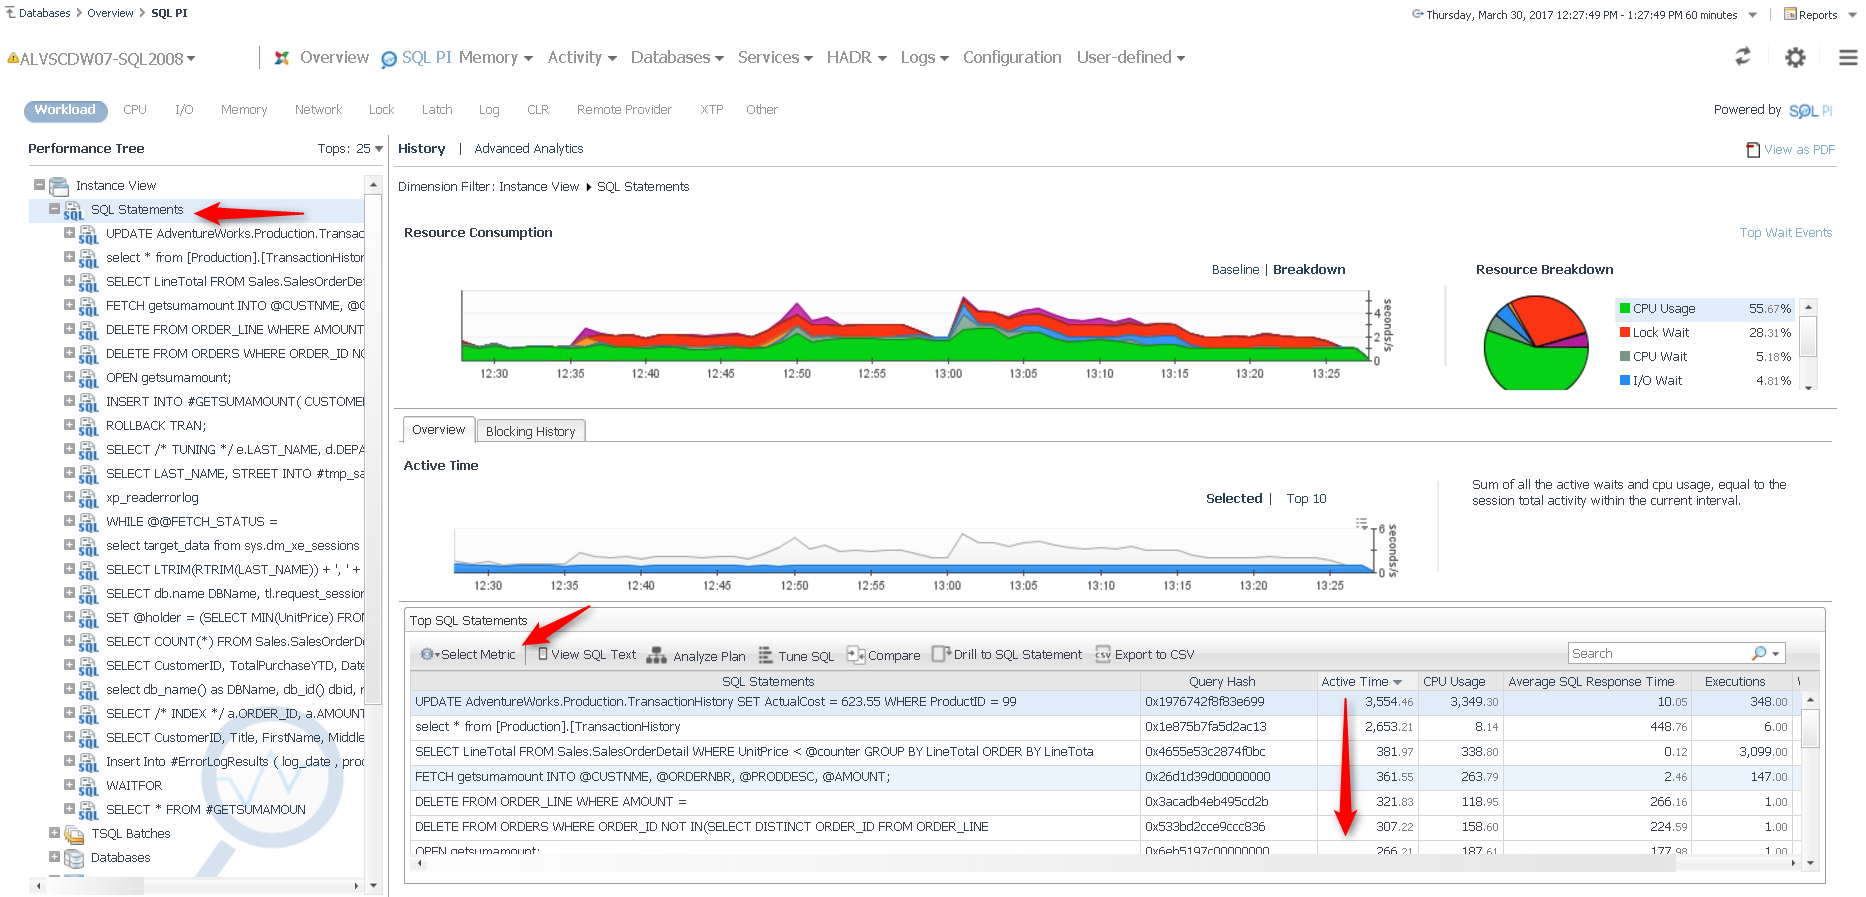
Clicking on SQL Statements populates the detail pane along the bottom of the screen. Now you can see how we came up with the ordering of the statements: The statement at the top of the list had the highest “Active Time”. Active Time is the total time in seconds that all executions of the statements created across all resources during the time you’re viewing.
The Select Metric button lets you add additional columns to the detail pane so that you see the exact amount of time demanded of each individual resource making up this total.
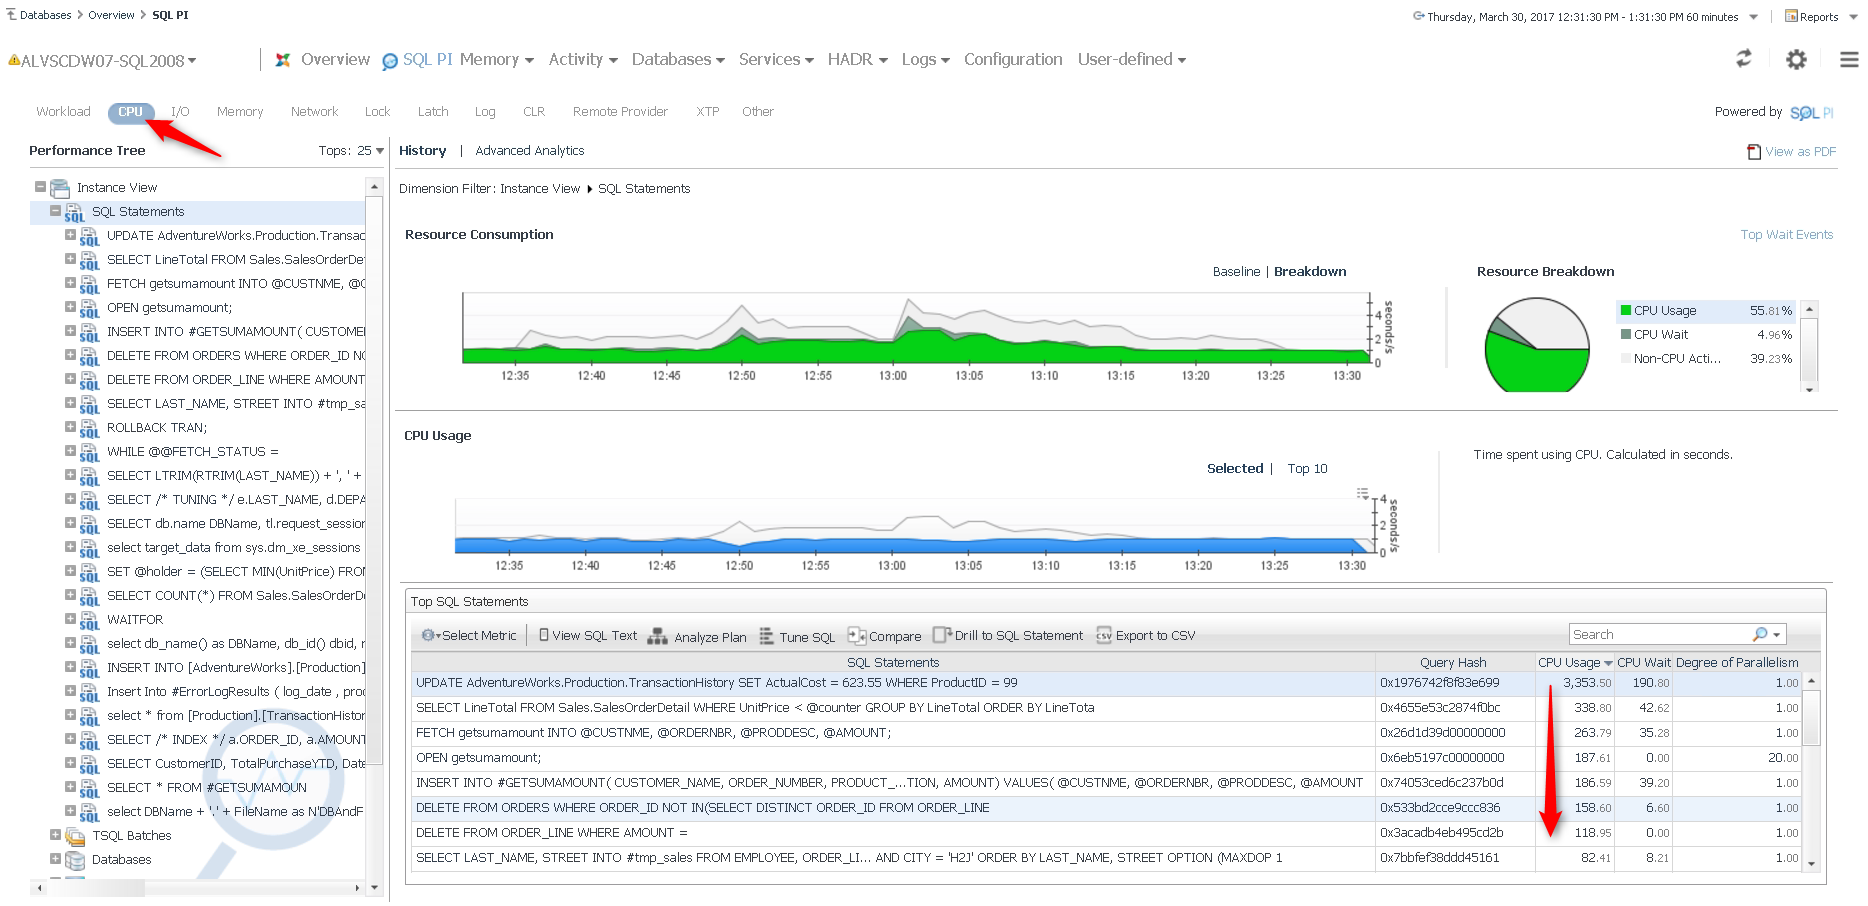
You can also reorder the statements in the list by specific resources. So if you wanted to know your heaviest statements just in terms of CPU load, you can click on the CPU filter. Now your statements are ordered by their contribution to CPU load (again, from heaviest to lightest).
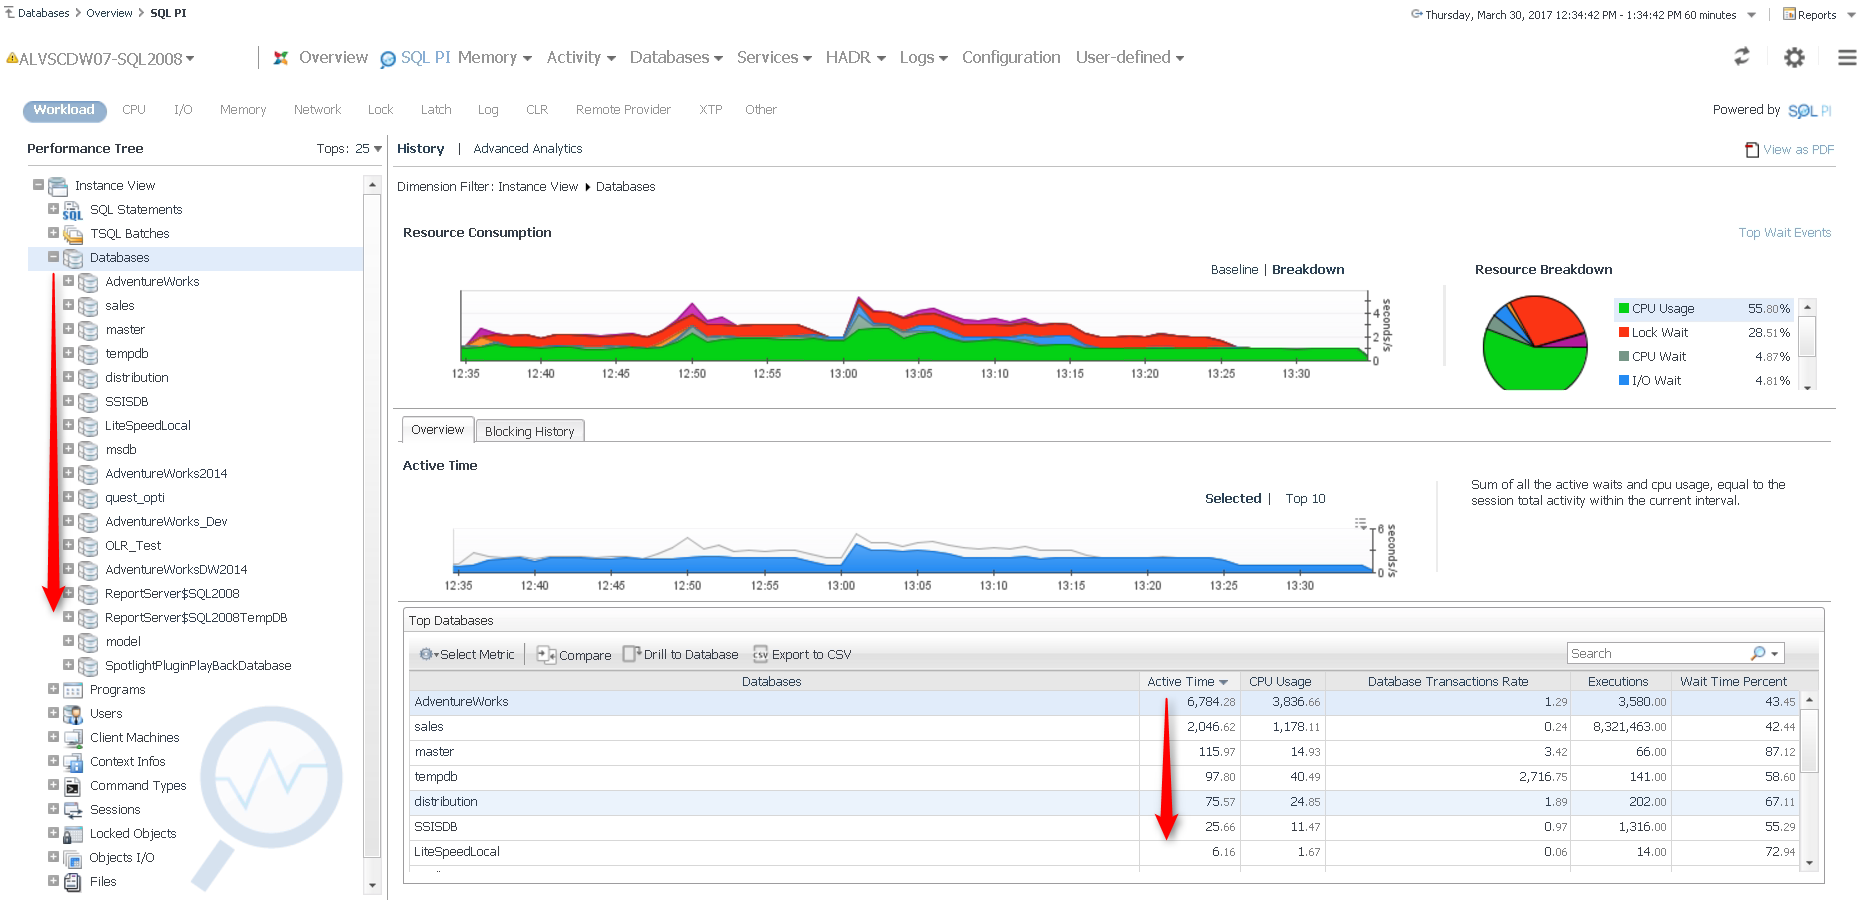
Let’s collapse the SQL Statements dimension and expand out the Databases dimension. This gives you a list of your databases, ordered from most active to least active.
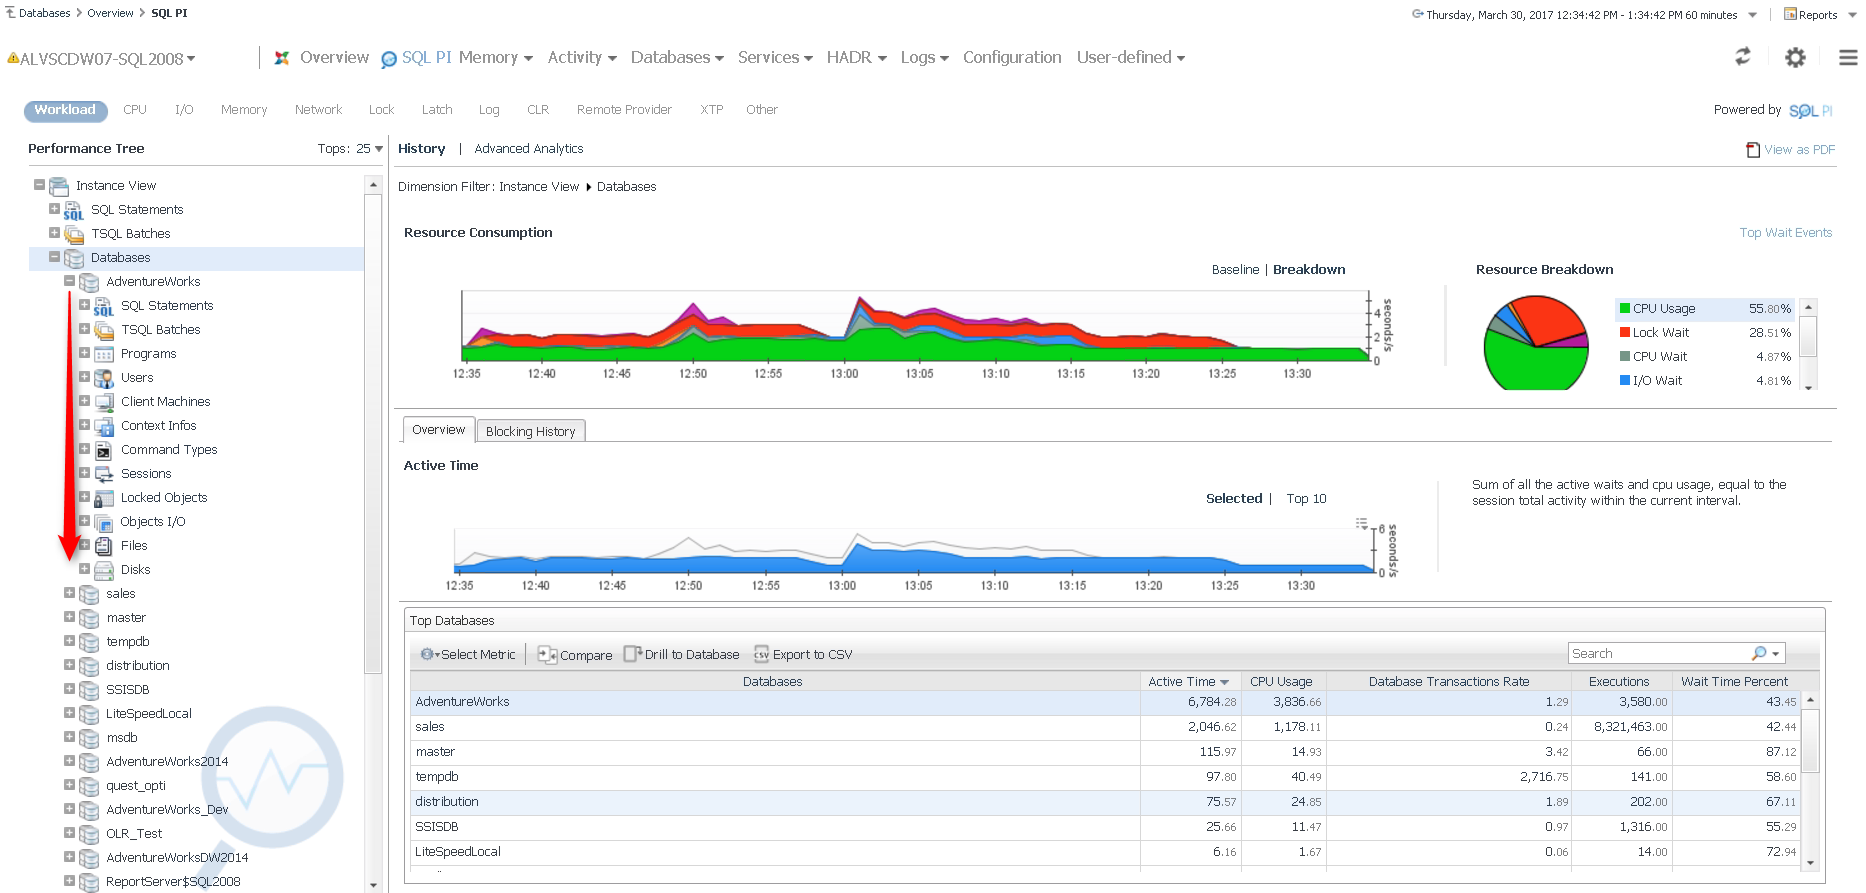
Now we can expand out a database of interest (usually a busy one, near the top of the list), and see details about just the activity on that database.
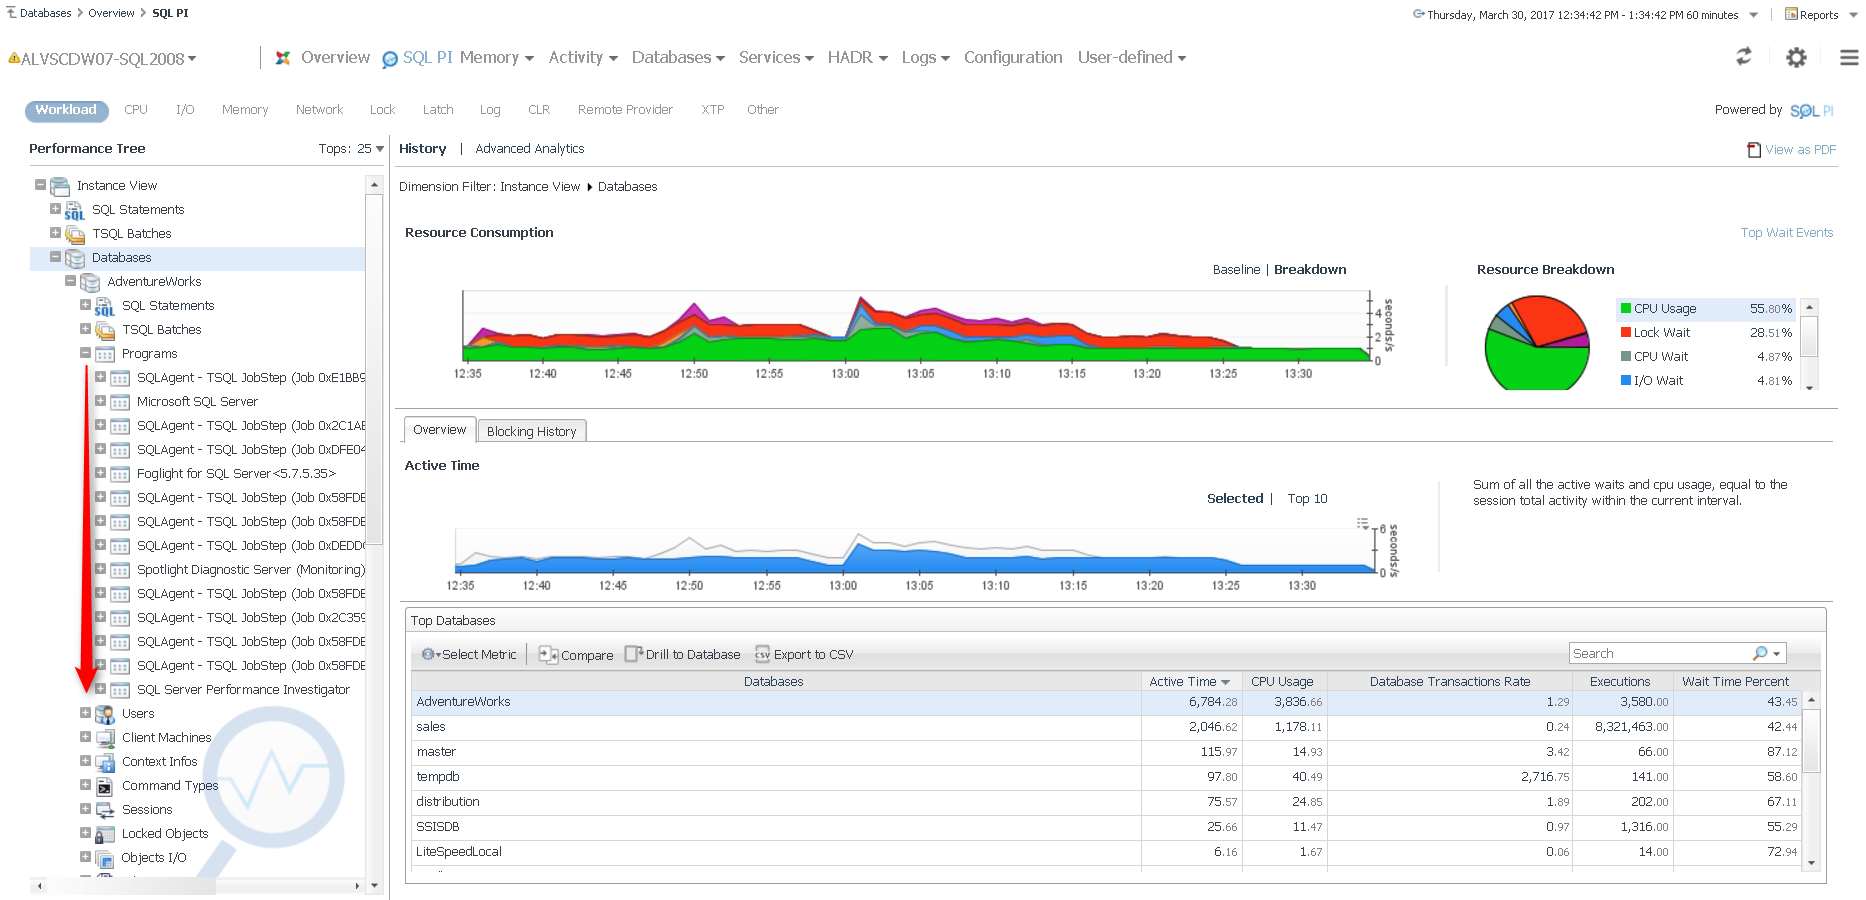
So for example, we can expand the Programs dimension to see just the applications that hit, in this case, the AdventureWorks database (ordered, as always, from heaviest to lightest).
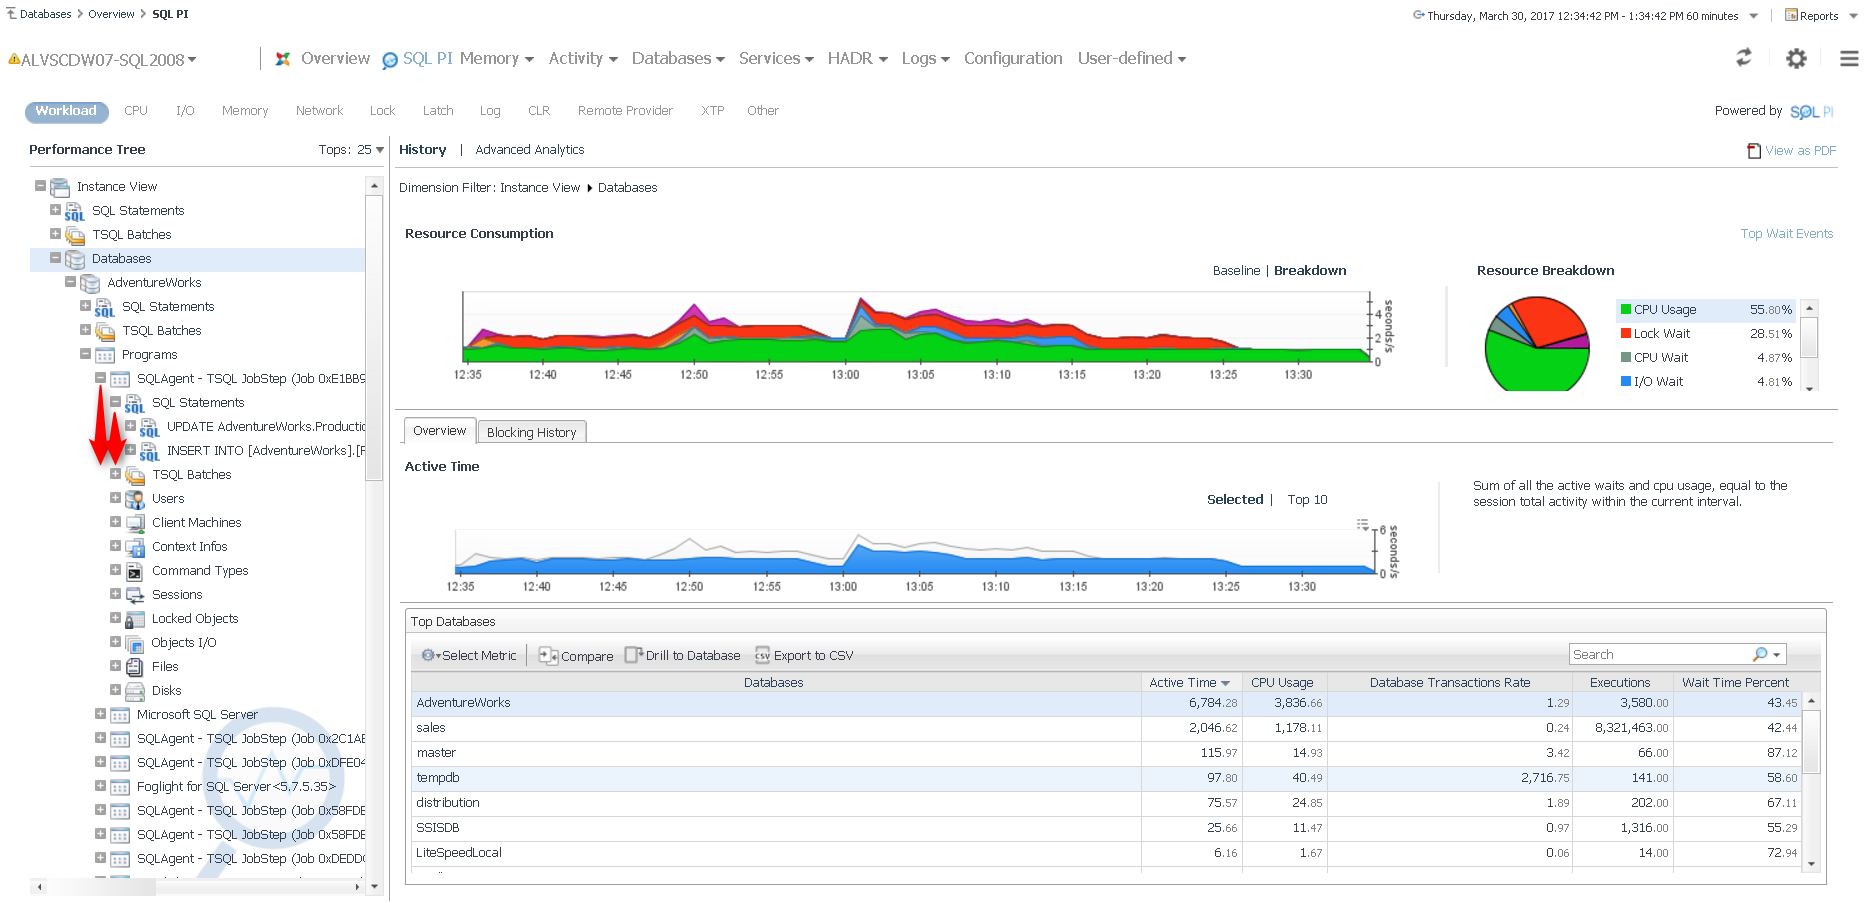
Then we can expand out the most active application and then the SQL Statements dimension below to it to view just the statements that this application ran against the database.
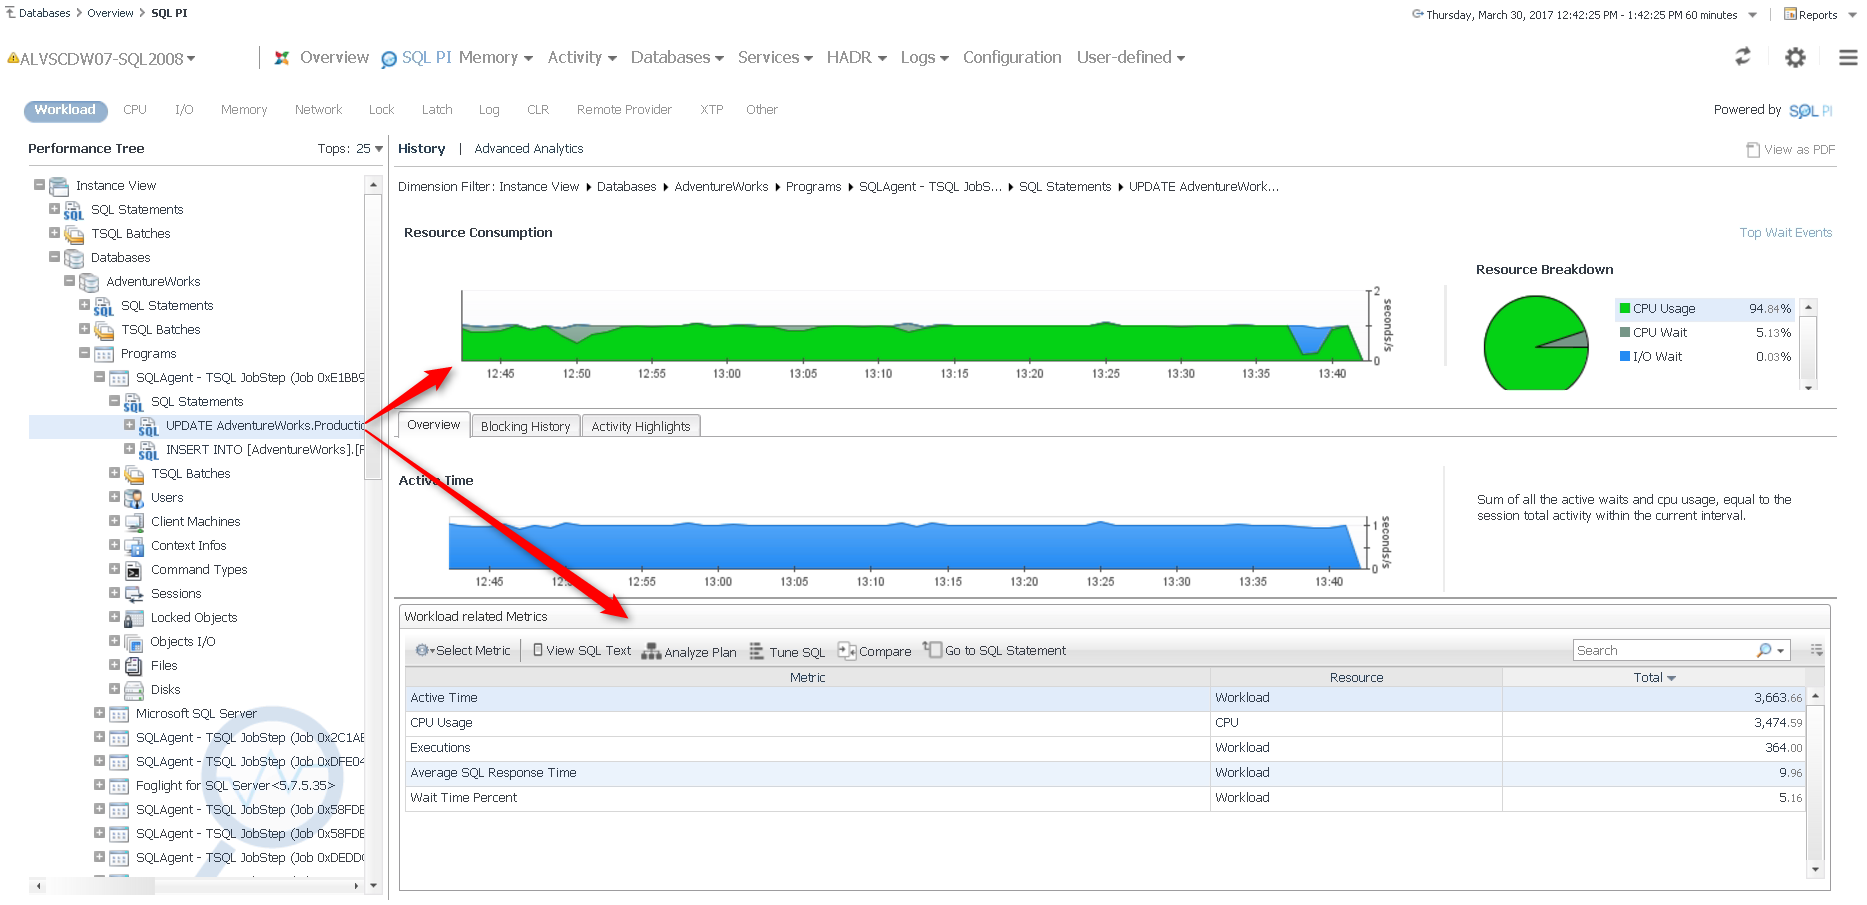
Once we’ve found a statement of interest, we can select it to see graphs for the workload and resource consumption it caused. Notice also that the in the tree control the statement has a small “plus sign” icon that lets you expand a branch below it. That’s how you can find out the user who ran the query and from what machine, along with lots of other context. And we can delve even deeper into a statement by clicking Analyze Plan.
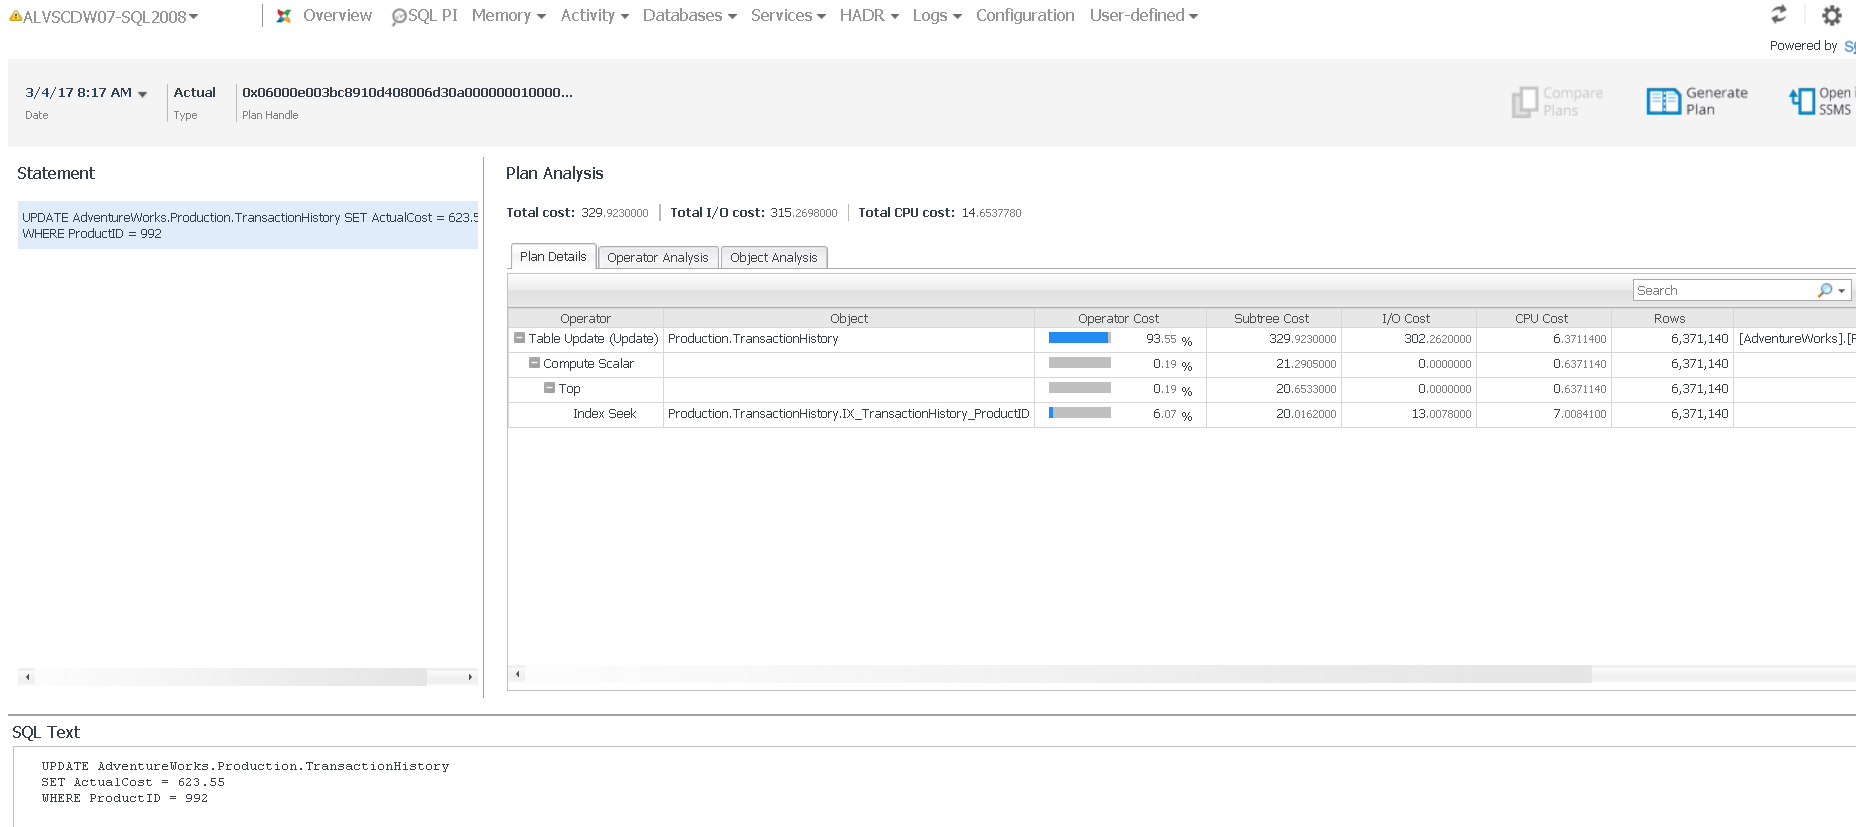
10 – Plan Analysis lets you see the text of a statement of interest, along with the actual query plan that it executed under. Now you know not just which queries were your heaviest hitters, but why.
So there you have it – with Foglight for Databases/SQL Server‘s SQL Performance Investigator, you’ve been able to get from the total database server workload right down to the statements most responsible for it, along with all of the context of the statements, in just a few clicks!
All of my Quest Database Performance blog posts can be found here.
