
Before application users are affected! That’s when everyone would like to see database performance problems addressed. However, if you’re like many of the DB2 LUW customers I work with, and how I functioned during my DBA days, you find yourself all too often being reactive about DB2 LUW performance issues. Being reactive means that you’re in “firefighting” mode a lot – chasing down emergencies while application users and in-house data consumers are complaining. There are obvious advantages to taking a proactive approach. For one, you can know about problems before they become application user problems. But, how do you become more proactive?
Your monitoring solution should help you be proactive. Five things to focus on for your monitoring strategy to help you get more proactive are:
- Warning alarms
- Alarm history
- New alarms
- Dynamics of database activity
- Baselines (what is normal)
Let’s examine these ways Foglight from Quest Software can help you know about, diagnose, and address DB2 LUW performance issues quicker, before they cause too many customer experience problems:
Warning alarms are important
To get alerted on a warning condition, before it’s critical or fatal to your users, you can use Foglight’s features to tune these ‘lower level’ alarms and make them more useful.
Foglight comes already equipped with many warning alarms (and some set to alarm at more severe levels) on key DB2 performance metrics, enabled as soon as you install. The threshold values for those metrics that trigger alarms are set to default values, set by our Foglight product team – with considerable thought behind them, mind you. But every environment is different. So, your warning alarms need to be tuned to fit your own databases – otherwise, you might be far too many (an “alarm storm”), which isn’t conducive to effective DB2 tuning. Where do you start? And which alarms should you actually pay attention to? The key is to optimize your warning alarms so that you are truly being alerted when, and only when, there is a problem beginning to build.
If your DBAs can get email notifications at a warning condition, they stand a much better chance of addressing it quickly, before it gets worse, and perhaps before application users notice any performance degradation. That’s the goal.
Ok, how do I make better use of warning alarms, pre-critical and pre-fatal? Here are some key steps:
- Determine, with your application team, acceptable performance levels. Realize that this (what’s “acceptable”, or achievable) will likely change over time – more on that shortly.
- Set warning alarm thresholds on key metrics to values that reflect a tipping point past, but not too much past, “acceptable” levels. Gauge this by which indicators got “worse” during a time of poor performance.
- Consider baselines in setting accurate warning thresholds. More on baselines shortly.
- See and draw from history of the metric – a strength of Foglight and its built-in contextual graphs and ability to customize a view of key metrics.
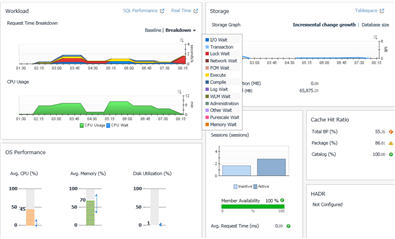
Figure 1: Historical trends of some key performance metrics on the Foglight DB2 History Overview screen, with some spikes/bumps during the day. Need a warning alarm threshold set to take those higher values into account (and be alerted about them)? Metrics like lock wait time or hit ratios may require some adjustment to their alarm thresholds so warnings are issued when values indicate a problem in the context of your actual database performance against ‘acceptable’ performance.
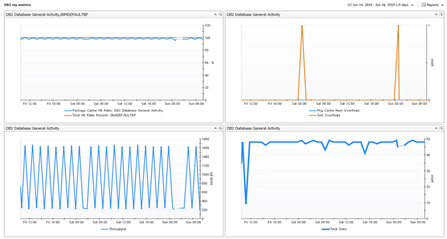
Figure 2: Historical trends of a key performance metrics displayed on a concise custom view. These can be very helpful in seeing how these metrics act when DB2 performance slows down. Set alert threshold levels so that when a spike starts to build, a warning is issued.
Alarm history is important
Another way of making sure you aren’t getting alarms you really don’t care about – just those that truly represent “problems”, is to use alarms and their historical trends to realize the “new normal”, say, after a database configuration change or a change to the data or the application (new workload).
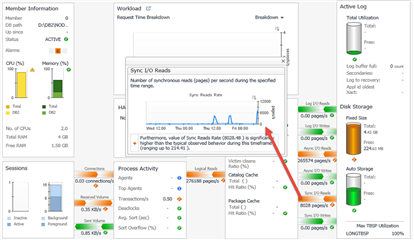
Figure 3: Historical trends associated with metric that was the subject of an alarm, or series of alarms
New alarms tell a story
Learn from new alarms that begin to fire. Are they reflecting a “new normal”, or is it just a blip that you can live with occasionally? If it appears to be a continuing/permanent condition, revisit our warning (and critical/fatal) alarm threshold settings.
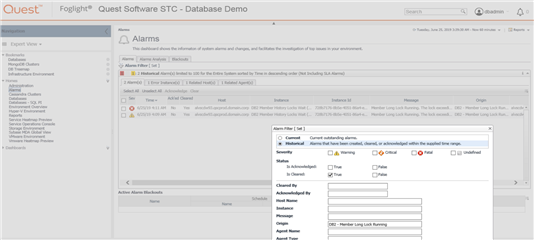
Figure 4: New alarms that haven’t appeared before, or very often – as seen in “Alarms” history. Filter this view to see alarms for any time frame, and for any error message string or type of alarm. In the example above, there haven’t been repeated firings of the same alarms observed, so perhaps we’ll check back later to see if they have.
Harness your database’s dynamics for better alerting
Know if your alarms are firing because of database behavior differences by the day of the week or the time of day. How will you know? Baseline alarms should “learn” new time-sensitive patterns in your performance indicators during the day. But threshold type alarms depend on accurately-set threshold values for alerting. Look at history trends (graphs, etc.) over a period of time and see how the metric fluctuates during most business days, weekends, etc. If you see consistent fluctuations, consider setting warning alarm thresholds to different values according to time of day. In Foglight, we call this scoping alarm thresholds and it’s done in Foglight registry variables. Resources to help with this:
Recorded webcast: Webcast: Rule and Alarm Management in Foglight
Blog posts:
Baselines are really important
Baselines are part of a proactive monitoring strategy, or should be. Foglight calculates these time-sensitive “normal ranges of behavior” and lets you know when key performance indicators deviate from normal on several key performance metrics. Baselines allow you to:
- Quickly rule out (or confirm) the database as the cause of application performance issues. If DB2 is acting “normally” today, right now, then any serious performance issues must be caused by something else!
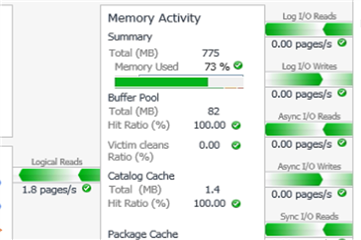
Figure 5: All of the Foglight reported DB2 performance is “normal” (green) – no baselines deviation alarms on this database.
- Quickly visualize if a key performance metric is now acting “differently” on a fairly regular basis. How will you know? Because of spikes above or below the baseline (normal) range of a metric as calculated by Foglight’s algorithms. A “new normal”, remember, means that tweaks are needed to the meaning of “acceptable” performance, and to alarm thresholds.
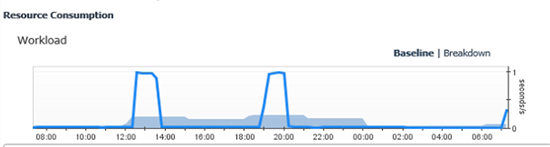
Figure 6: Baseline deviations on a graph in Foglight for DB2; here, workload trend. If tomorrow looks like this, or similar profiles appear so that the baseline is consistently low or missing those “daily spikes”, it’s a sign that something has changed on the database or in the workloads that DB2 is being asked to process.
As I stated at the start of this post, and in the title, we as DBAs could add a lot of value if we could be proactive and find performance issues on DB2 quicker – as they just begin to appear. If we know about them, we can do something about them (at least we can give it our best shot) and maybe avoid some angry DB2 users and application teams.
There are certainly other ways to be proactive - you can tune SQL to reduce CPU usage and I/O, for example. Some of these other techniques and suggestions will be shared in upcoming posts about Foglight for DB2. Stay tuned!
Check out Foglight for DB2, if you haven’t already done so, and try for yourself some of the techniques I’ve described here. For more information about Foglight in general, or about DB2 monitoring specifically, visit the Foglight product page on the Quest website, here: https://www.quest.com/foglight-for-databases/
