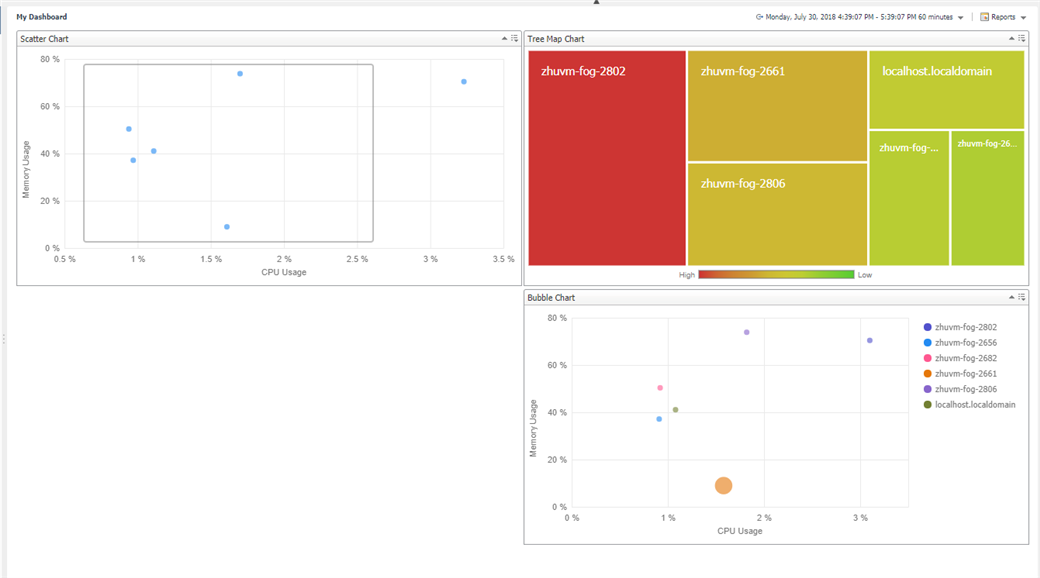
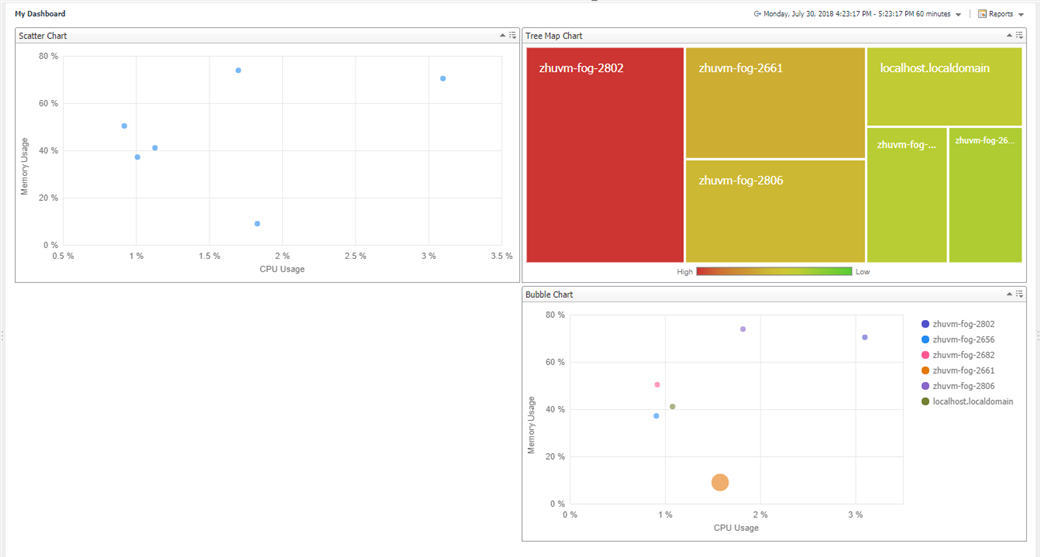
Foglight 5.9.3 introduced the following three new WCF components to show collected metrics in a variety of ways and to better analyze the collected data.
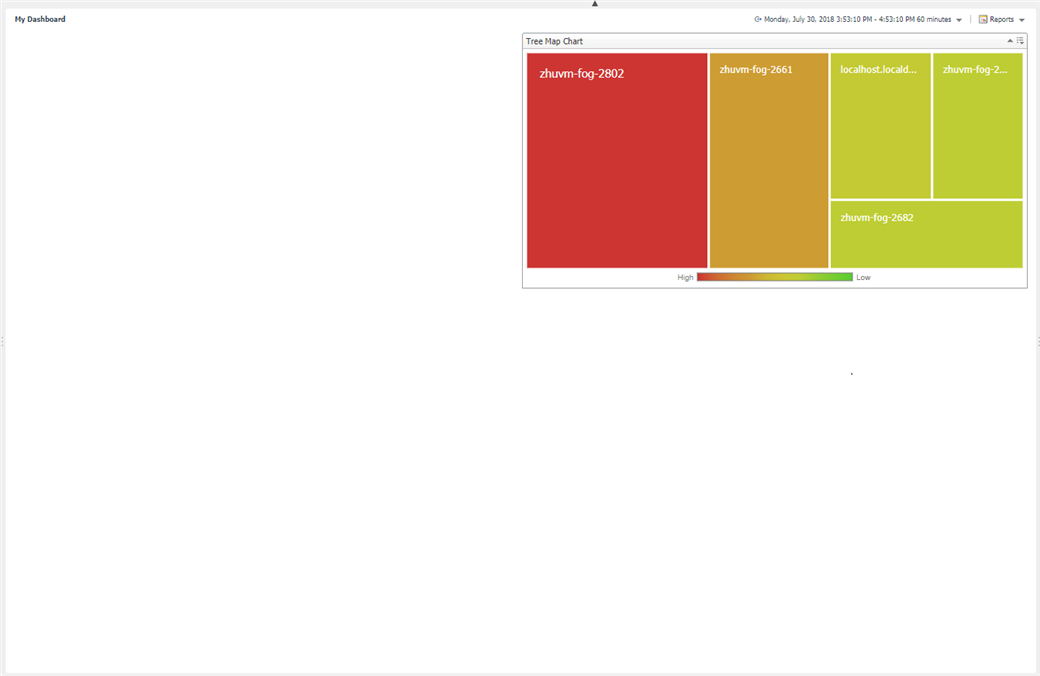
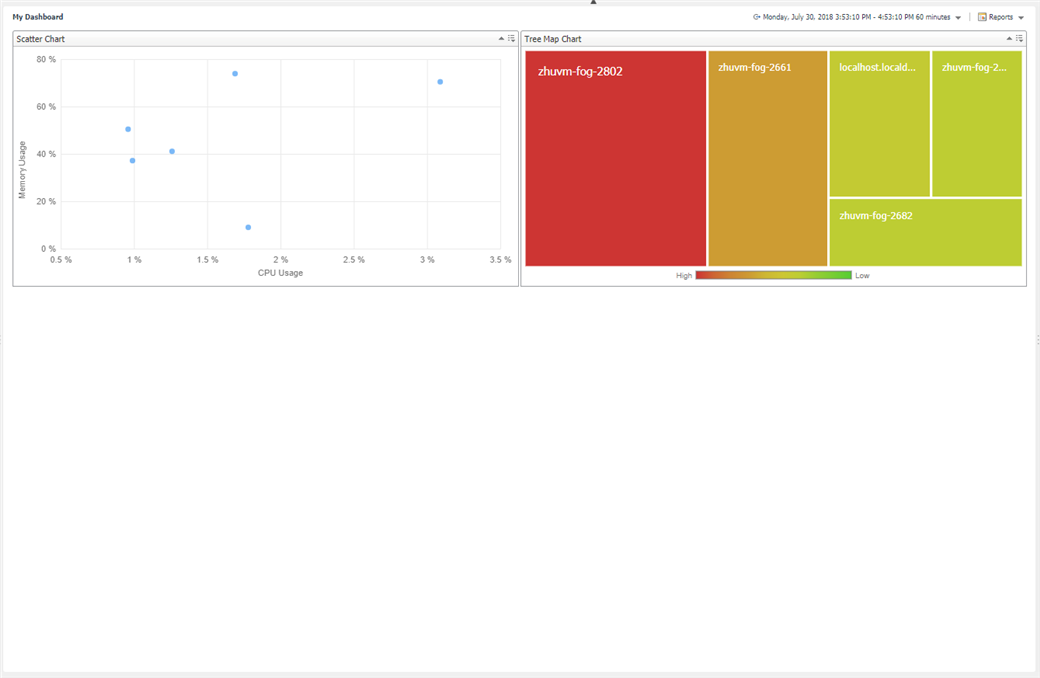
- Tree Map: Treemap displays hierarchical (tree-structured) data as a set of nested rectangles.Each branch of the tree is given a rectangle, which is then tiled with smaller rectangles representing sub-branches. A leaf node's rectangle has an area proportional to a specified dimension of the data. Often the leaf nodes are colored to show a separate dimension of the data.
- Scatter Chart: A Scatter chart plots a symbol for each point of data in a series. The symbols are useful to see if two variables are related to each other.
- Bubble Chart: A Bubble chart is the variation of a Scatter Chart where data points are plotted with bubbles. Bubble charts would be a good choice if you have series of data where each of them have 3 related dimensions.
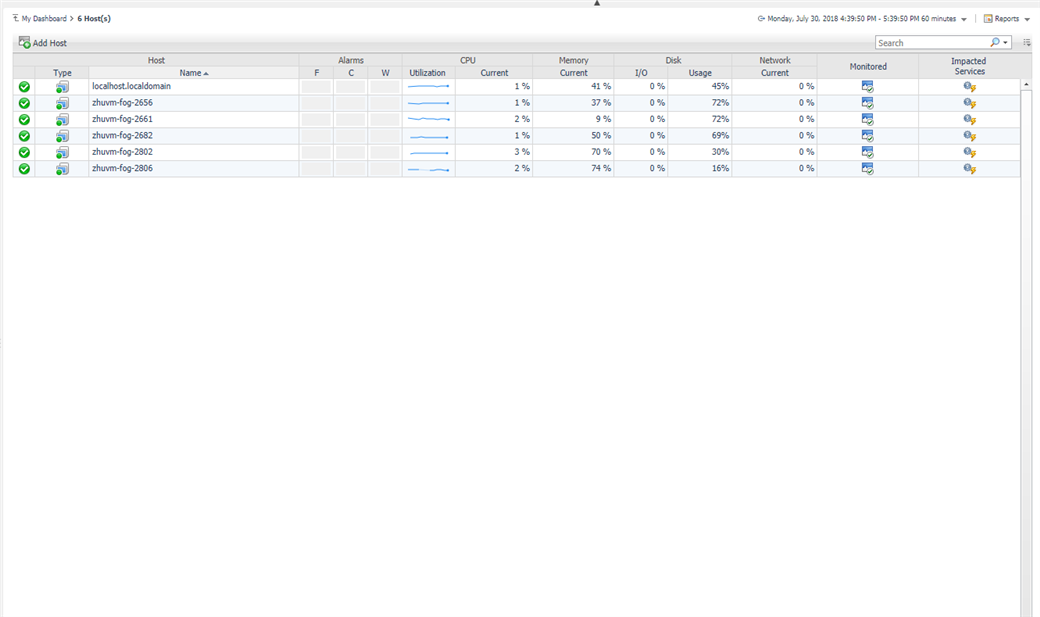
These charts are available for Custom Dashboards as well. The following describes how to add these charts to "My Dashboard". We'll use Hosts as the data input for the demo purpose.
Adding a Tree Map to the dashboard
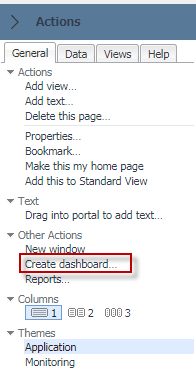
1. Open Dashboards > My Dashboards. If there is no custom dashboard or you don't want to use the existing ones, select General > Other Actions > Create dashboard... on the Actions panel. For details about how to create a custom dashboard, visit https://support.quest.com/technical-documents/foglight/5.9.3/user-guide/10#422008.

2. Click Add view... on the Actions panel. The Add View wizard opens. 
3. Select a list of DataObjects, for example a list of Hosts, then Analytics View in the lower right corner becomes available. Select Analytics View, and then click Next.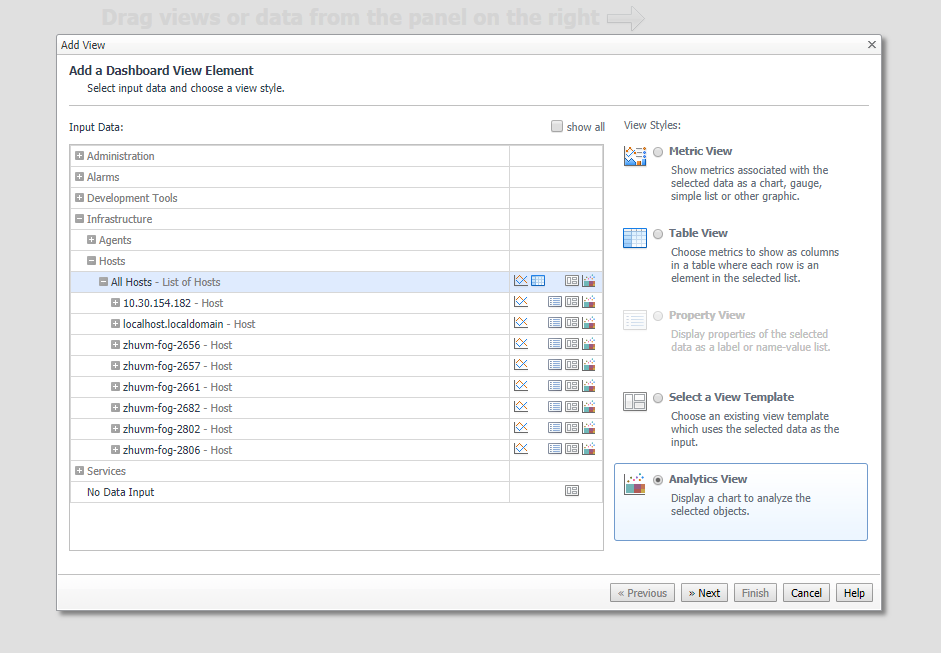
4. Select the first chart type, and then configure the properties binding to Tree Map.
Note: The type of name property must be String, while the type of Size and Color properties must be Number.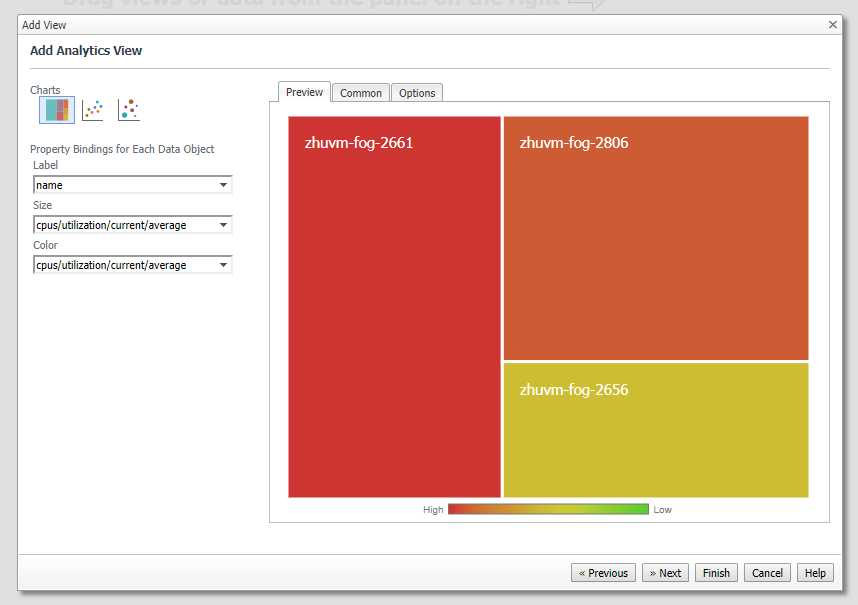
5. Click Finish. The dashboard refreshes automatically, showing the new Tree Map.
Adding a Scatter Chart to the dashboard
1. Open Dashboards > My Dashboards. If there is no custom dashboard or you don't want to use the existing ones, select General > Other Actions > Create dashboard... on the Actions panel. For details about how to create a custom dashboard, visit https://support.quest.com/technical-documents/foglight/5.9.3/user-guide/10#422008.
2. Click Add view... on the Actions panel. The Add View wizard opens.

3. Select a list of DataObjects, for example a list of Hosts, then Analytics View in the lower right corner becomes available. Select Analytics View, and then click Next.

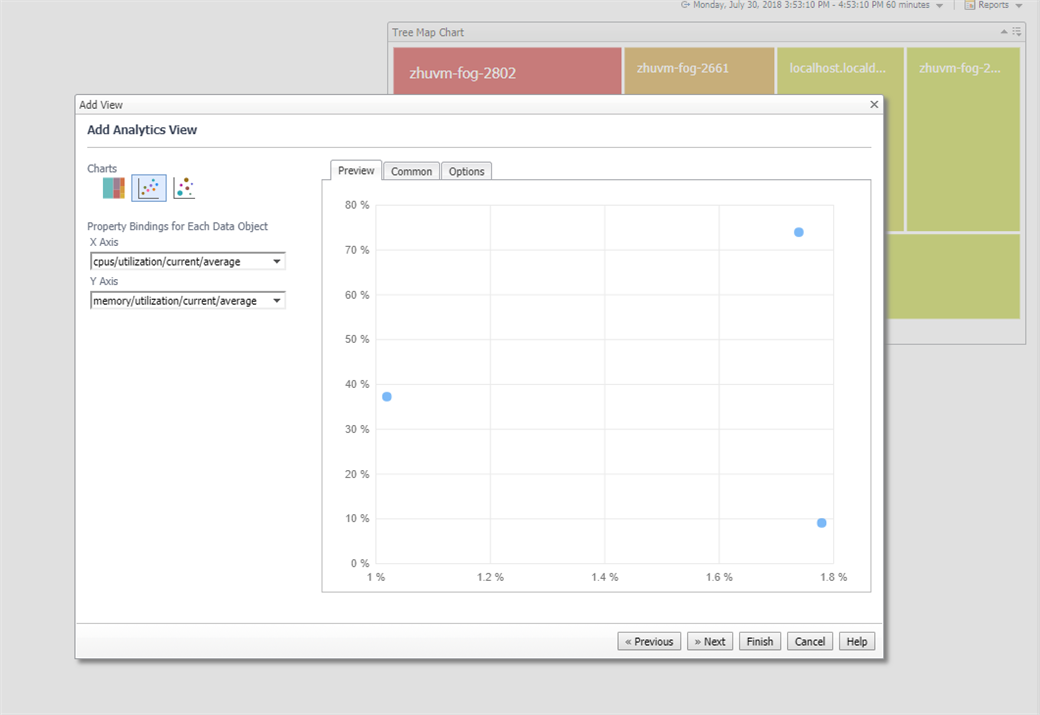
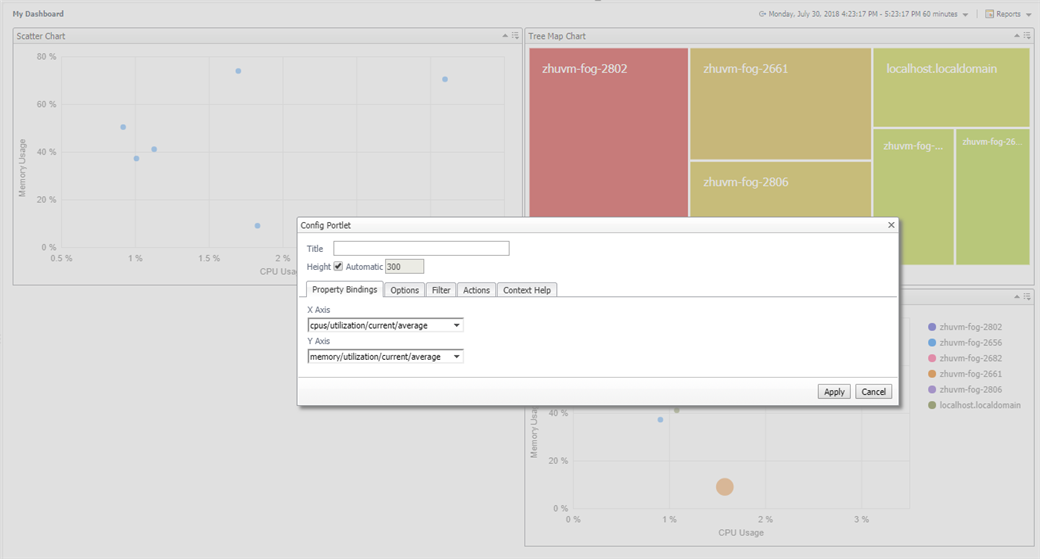
4. Select the second chart type, and then configure the properties binding to Scatter Chart.
Note: The type of X Axis and Y Axis must be Number.
5. Navigate to the Options tab and configure the axis labels.
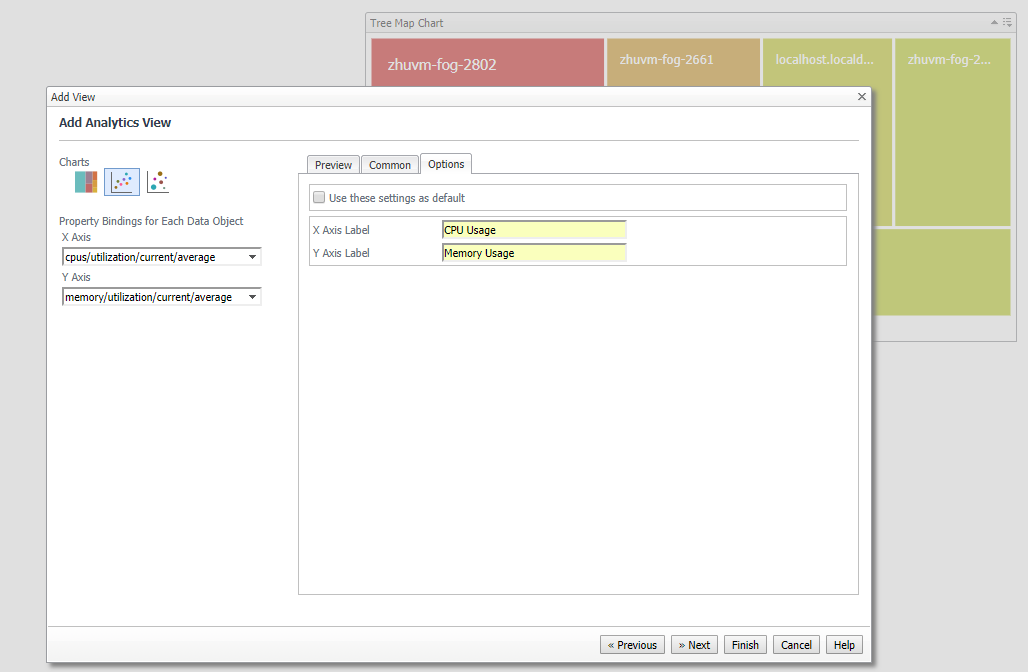
6. Click Finish. The dashboard refreshes automatically, showing the new Scatter chart.
Adding a Bubble Chart to the dashboard
1. Open Dashboards > My Dashboards. If there is no custom dashboard or you don't want to use the existing ones, select General > Other Actions > Create dashboard... on the Actions panel. For details about how to create a custom dashboard, visit https://support.quest.com/technical-documents/foglight/5.9.3/user-guide/10#422008.

2. Click Add view... on the Actions panel. The Add View wizard opens.
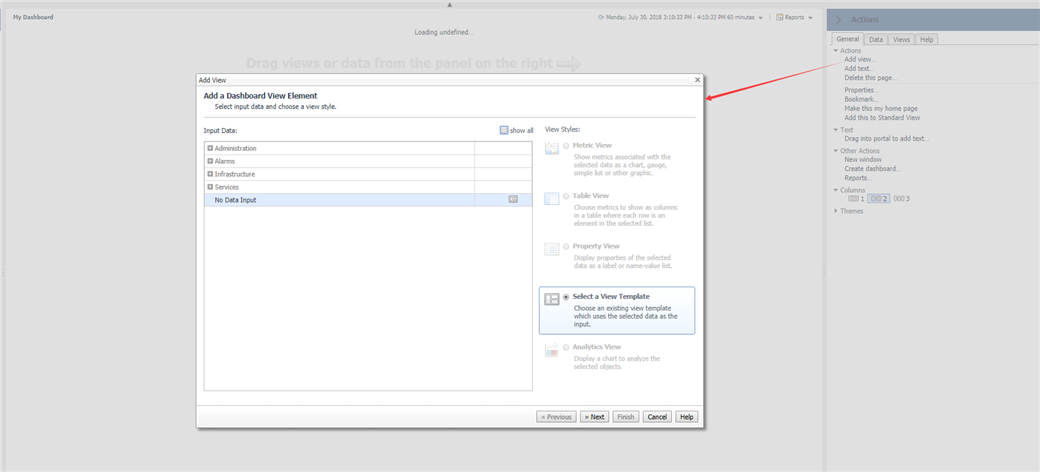
3. Select a list of DataObjects, for example a list of Hosts, then Analytics View in the lower right corner becomes available. Select Analytics View, and then click Next.

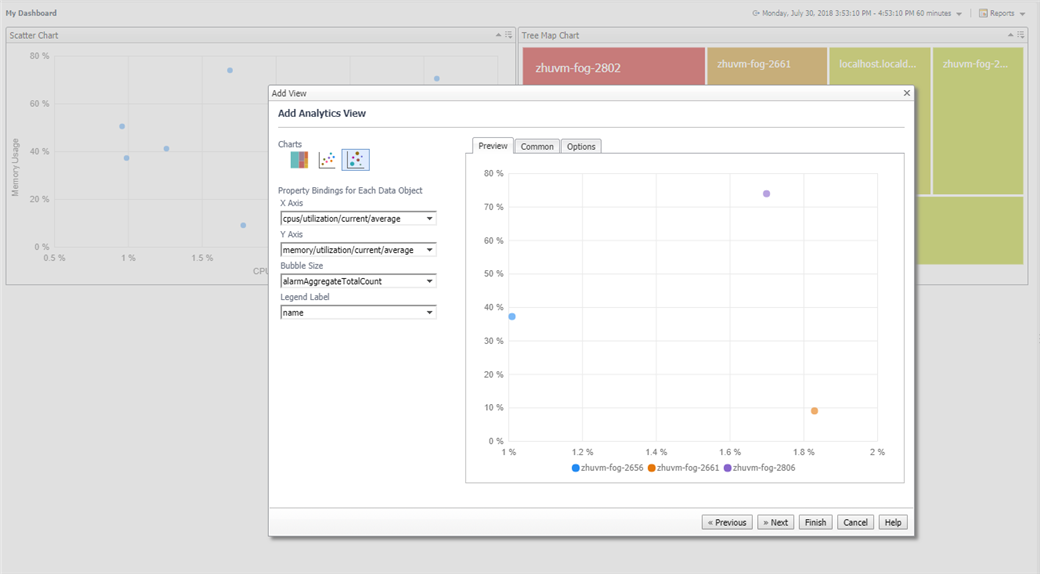
4. Select the last chart type, and then the properties binding to Bubble Chart.
Note: The type of X Axis ,Y Axis and Bubble Size must be Number. Legend Label is optional. The legend will appear on the chart if you set the label here.
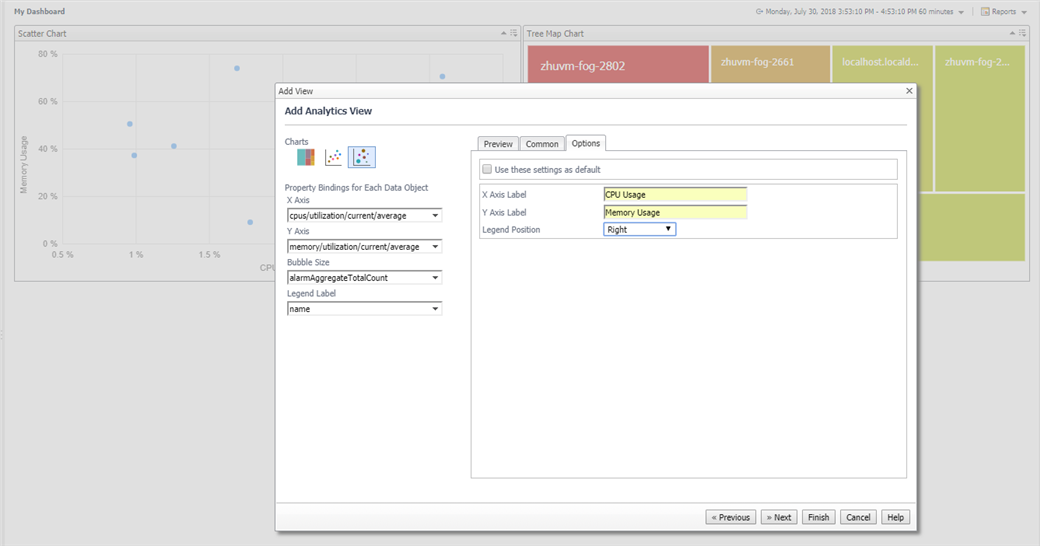
5. Navigate to the Options tab and configure the axis labels and legend position.
6. Click Finish. The dashboard refreshes automatically, showing the new Bubble chart.
Configuring actions for Scatter Chart
The Management Server offers the capability of configuring actions for these new components. We'll take Scatter chart for example to demonstrate this procedure. Please be aware that the view selected for the action is a Foglight internal view only. If you couldn't select a view in your environment, which means there are no available views matching your data, you need to create your own views through WCF IDE.
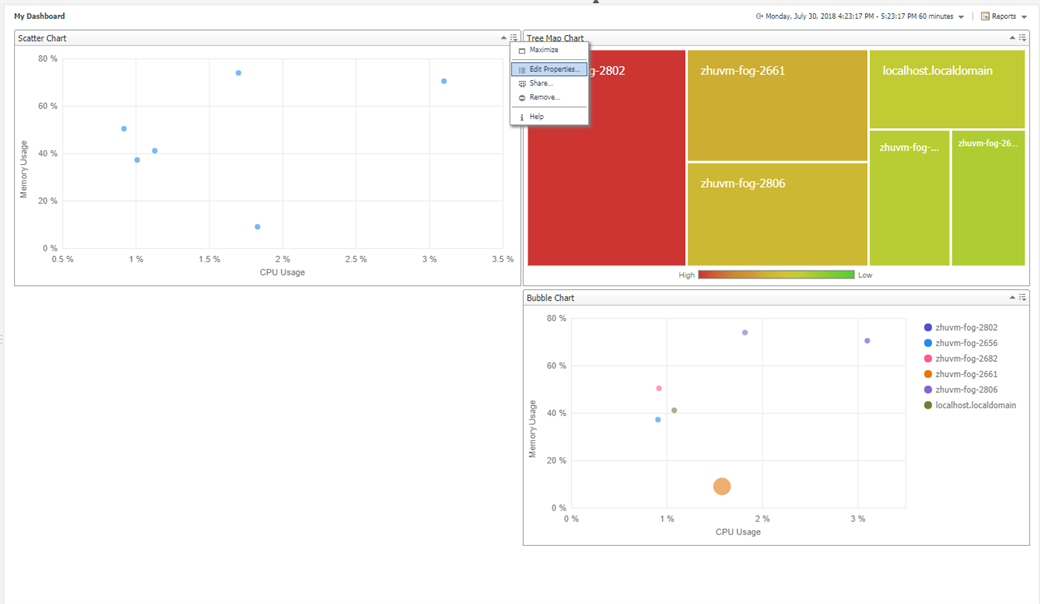
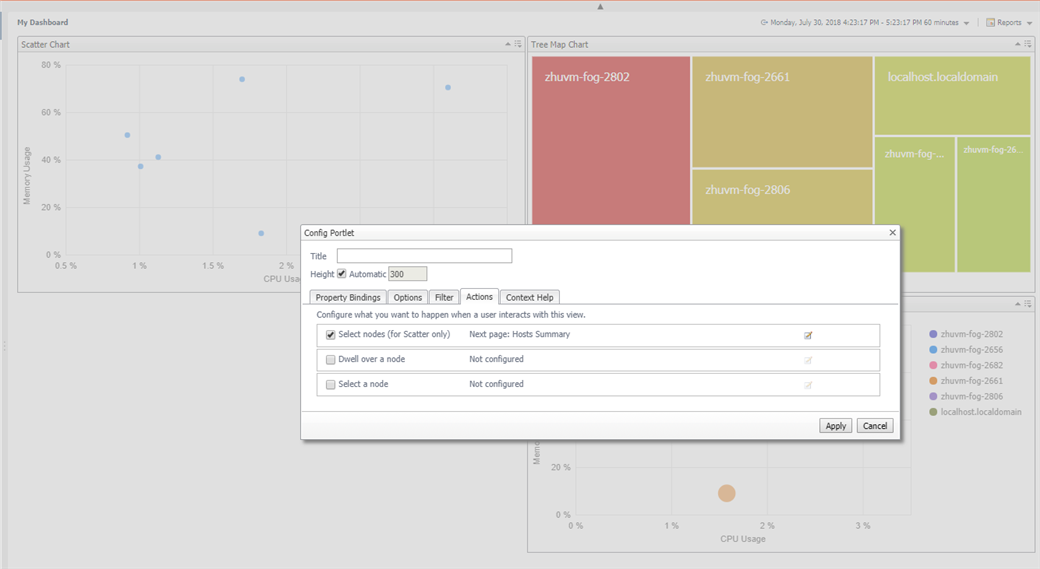
1. Click the Customizer icon on the upper right corner of the view, and then click Edit properties... The Config Portlet dialog appears.
2. Switch to the Actions tab, check the action you want to configure, and then the Edit icon becomes available.
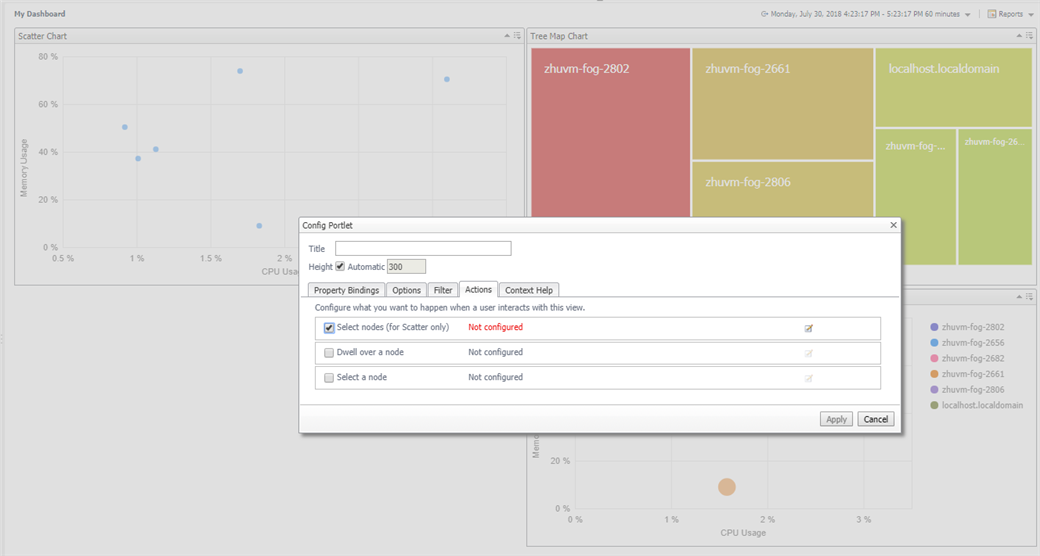
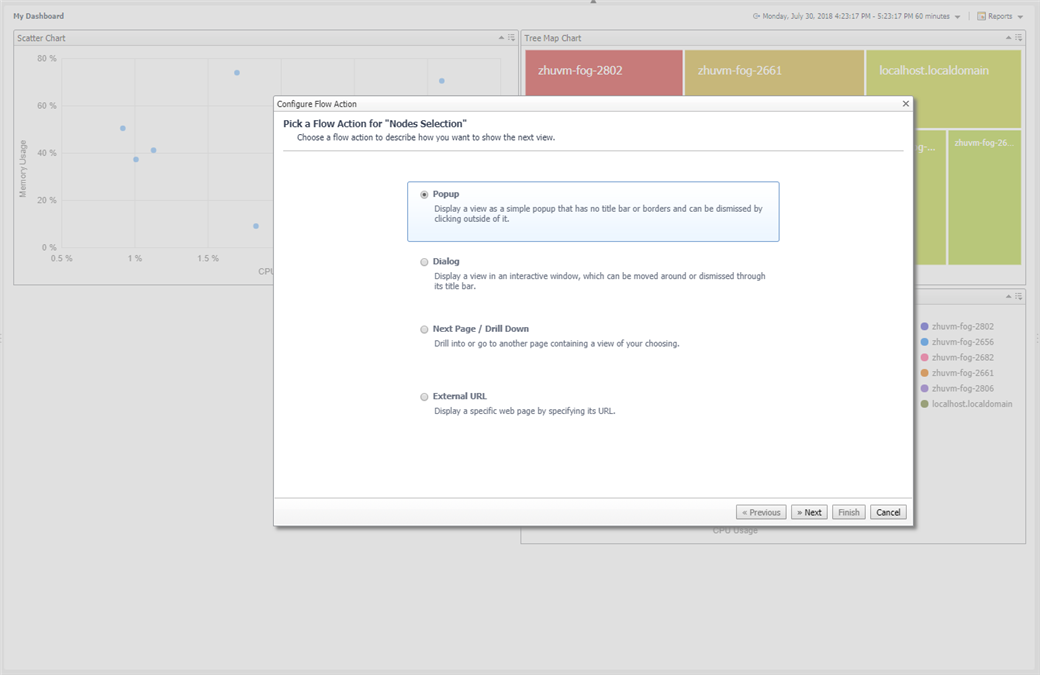
3. Click Edit icon and the Configure Flow Action wizard appears. Select Next Page / Drill Down, and then click Next.
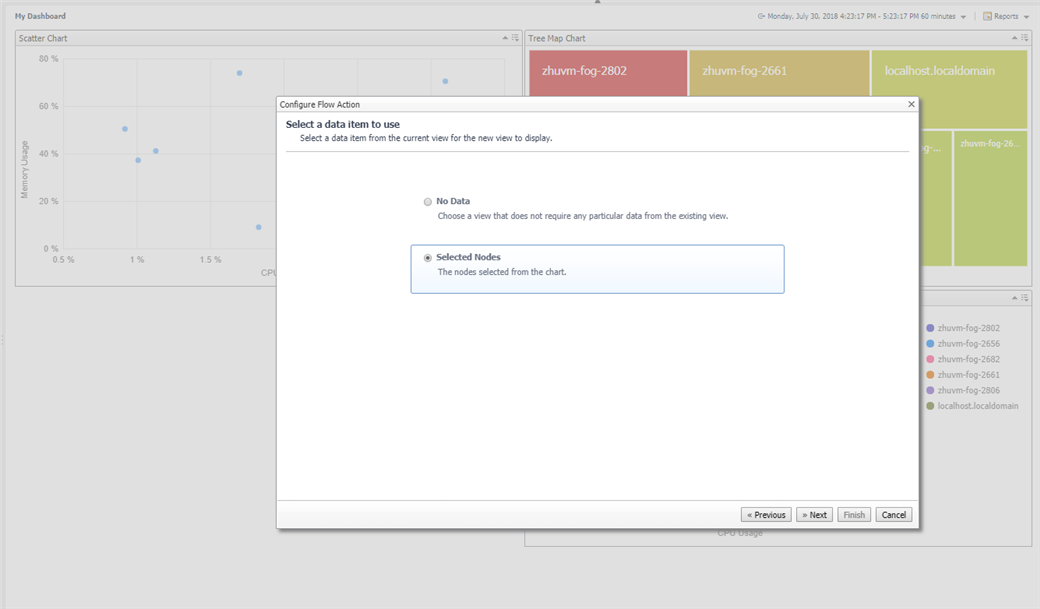
4. Select Selected Nodes, and then click Next.
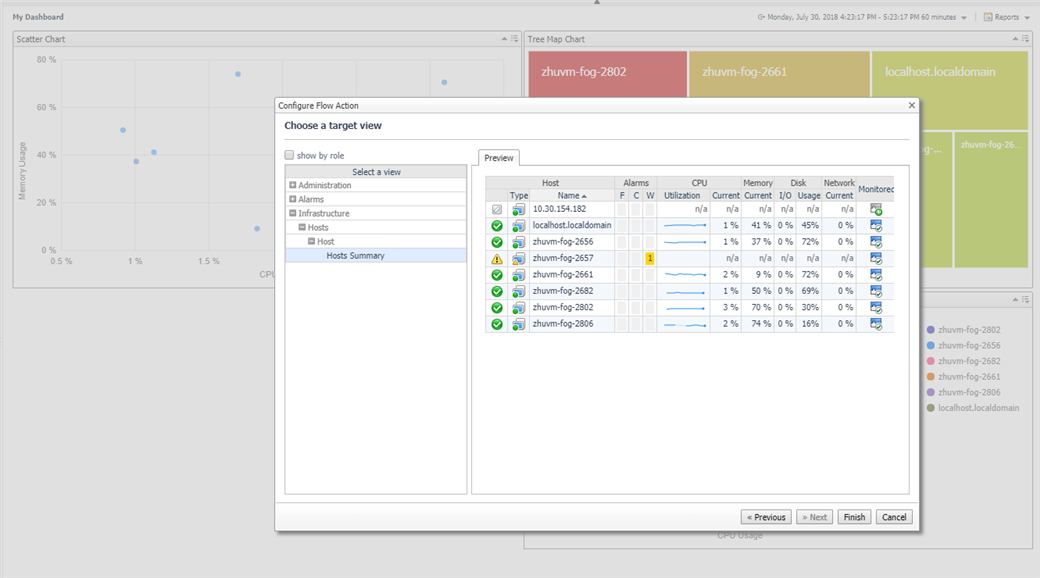
5. Select a view that matches the selected data, and then click Finish to complete the wizard.
6. Click Apply to exit the configuration editor.
7. Drag a rectangle on the scatter chart to check the added actions.