
Many of our Foglight users including myself have grown accustomed to using the "Databases" home as their starting point into their daily monitoring tasks. This dashboard provides a global view into all of the instances being monitored and gives the Foglight administrator access to alarm configuration and other settings related to the monitoring setup. From a metric perspective, the Databases home provides some useful high-level information about the instances being monitored including a Workload column which measures the the Average Active Sessions over the last hour. This is a great way to identify and prioritize which instances are experiencing more workload than others. At this point, the user can simply drill into the SQL PI dashboard and determine what type of resource consumption and more specifically the wait time associated with it (e.g. seconds waited in Lock Waits).
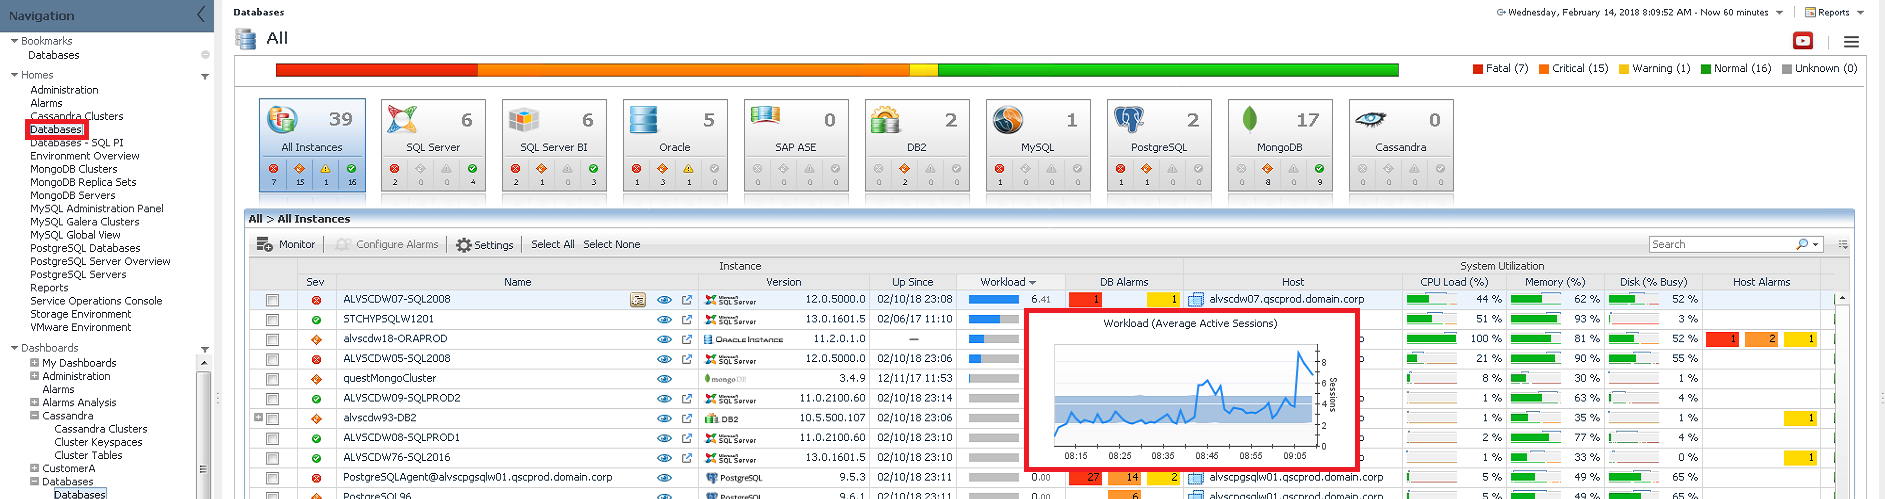
Fig 1 - Databases dashboard with mouse hovered over Workload column (Average Active Sessions)
What if you wanted to see the wait time distribution across all instances at a high level? Well, if you have SQL Performance Investigator (SQL PI) configured for the Oracle and SQL Server instances being monitored, you can use an out-of-the-box dashboard called "Databases - SQL PI", found in the list of Homes in Foglight, to get this high level view of wait time distribution.
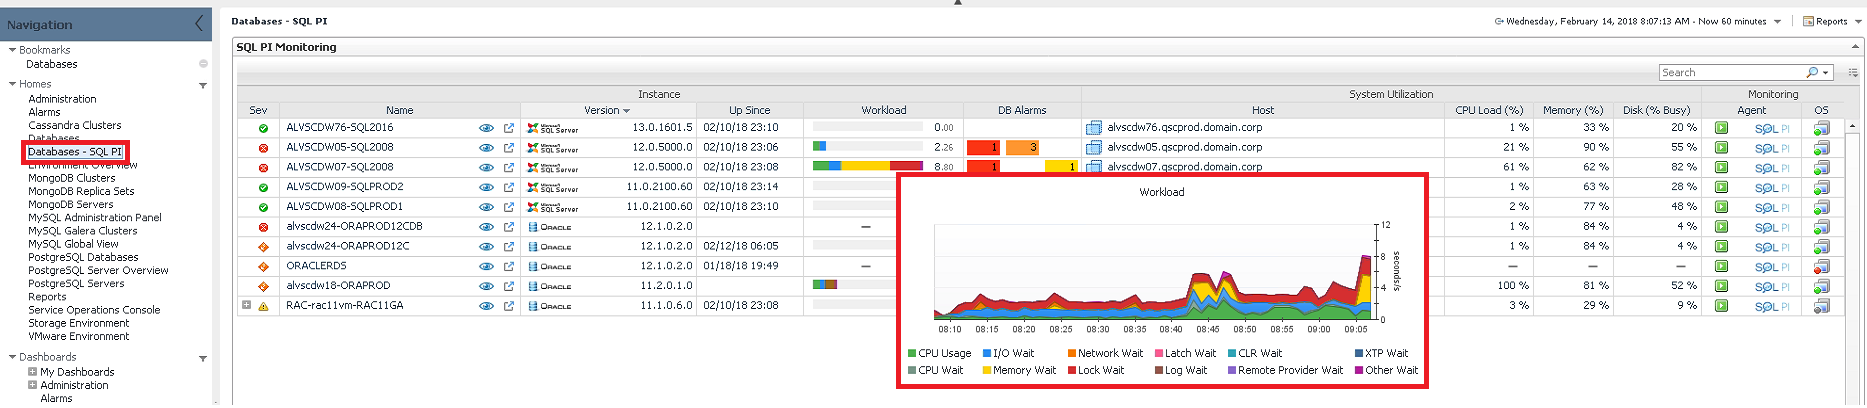
Fig 2 - Databases SQL PI dashboard with mouse hovered over Workload column (Resource Breakdown)
Once in the Databases - SQL PI dashboard, you will notice how similar the table looks when compared to the Databases dashboard. One subtle difference is the "Workload" column. In the Databases - SQL PI dashboard, it now focuses on wait time and if you put your mouse over the bar a color-coded Workload graph will appear breaking down the wait time across several different resource categories. These categories match the same categories you find when you drill down into the main SQL PI dashboard for a specific instance. Using the Workload column in the Databases - SQL PI dashboard gives the user a very efficient way of determining what effects the current workload is having on the underlying instance. In many cases it will help drive how you utilize the main SQL PI dashboard in your subsequent research.
Give the Databases SQL PI dashboard a try as part of your regular monitoring habit. I think you will find it useful!
