
I’ve been using PostgreSQL for many years, but mainly as an application back end database. I’ve never really had a chance to performance test a Postgres database and see what happens.
With the 7.3 version of Foglight we now have the SQLPI (Performance Investigator) feature and a new UI.
Like Foglight does with Oracle, SQL Server and mySQL, we can now monitor a Postgres instance and see which queries have the performance problems.
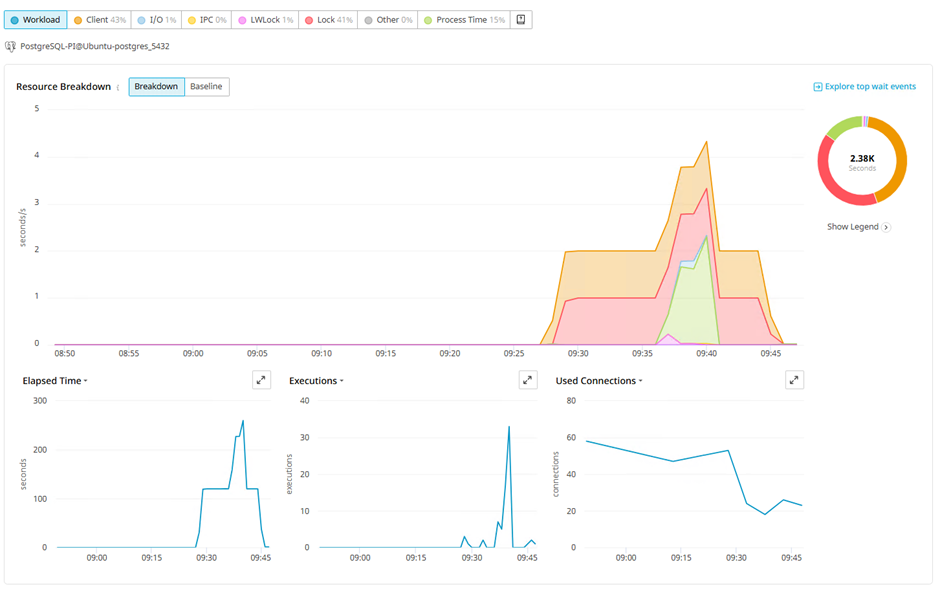
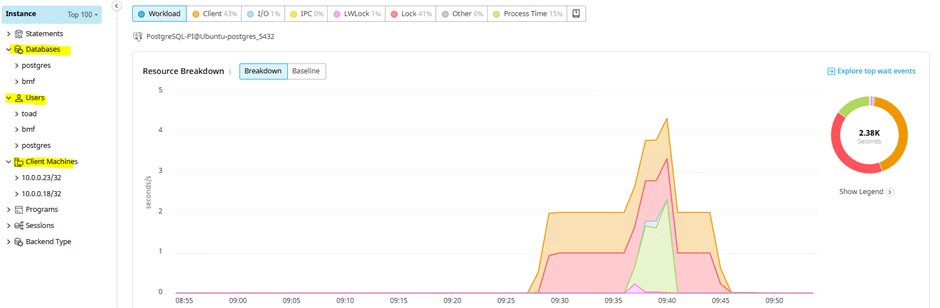
Here is an example of some workload:
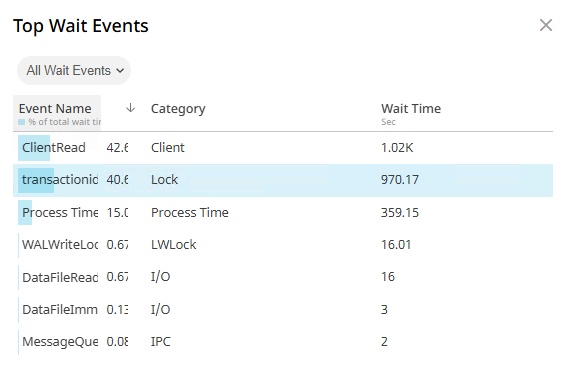
You can see which colours relate to which wait events, and a list here:
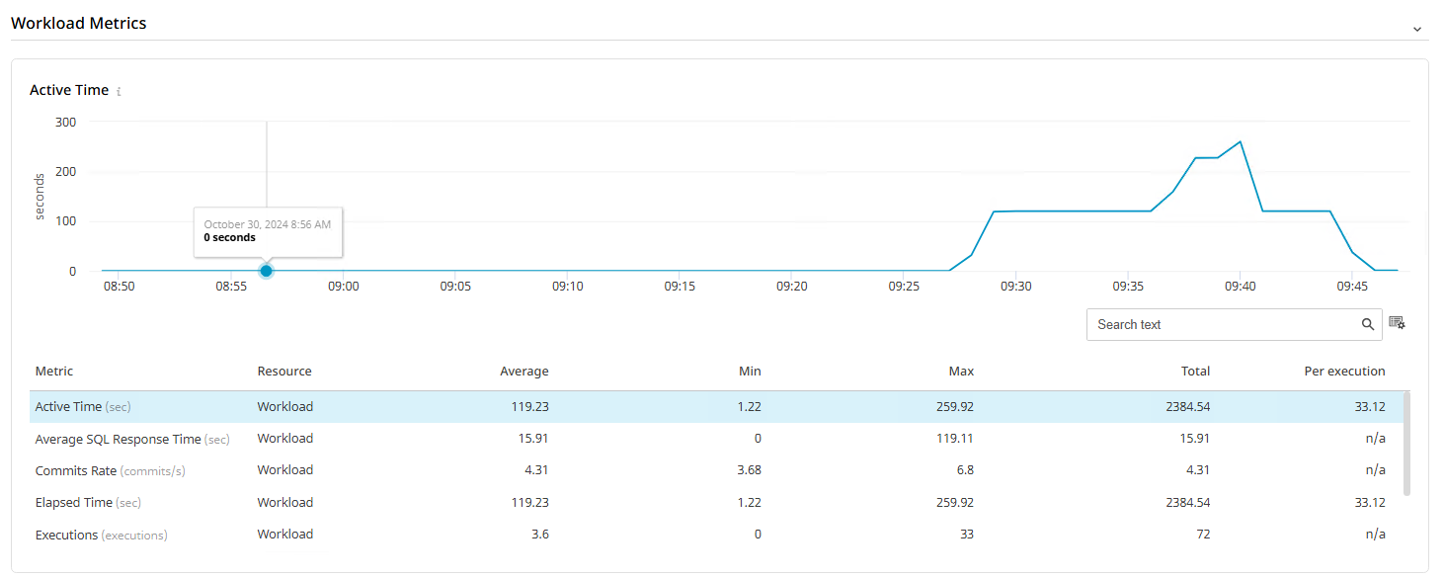
I can view various workload metrics at the instance level as well:
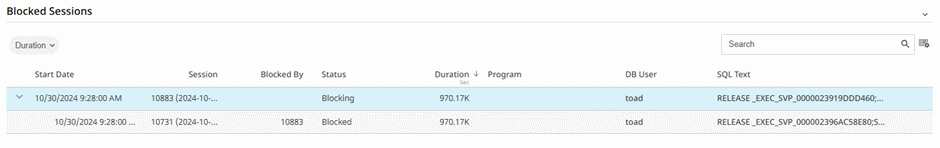
And historical blocked sessions:
But what is causing these issues and which user and database?
For that question I can use the dimensions filter on the left:
So, if I click on the postgres database:
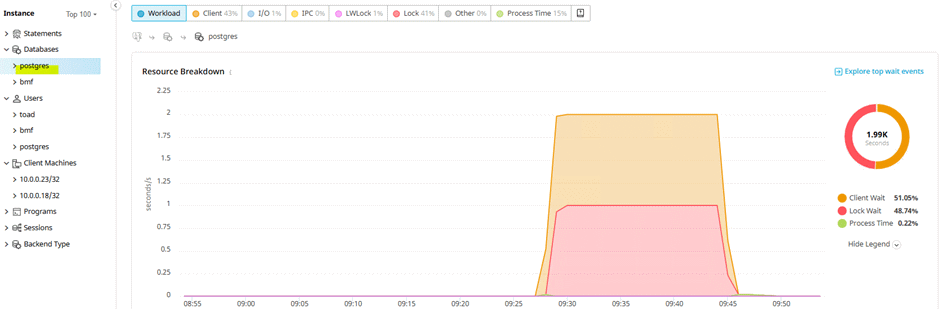
It’s this database that has the client and lock wait.
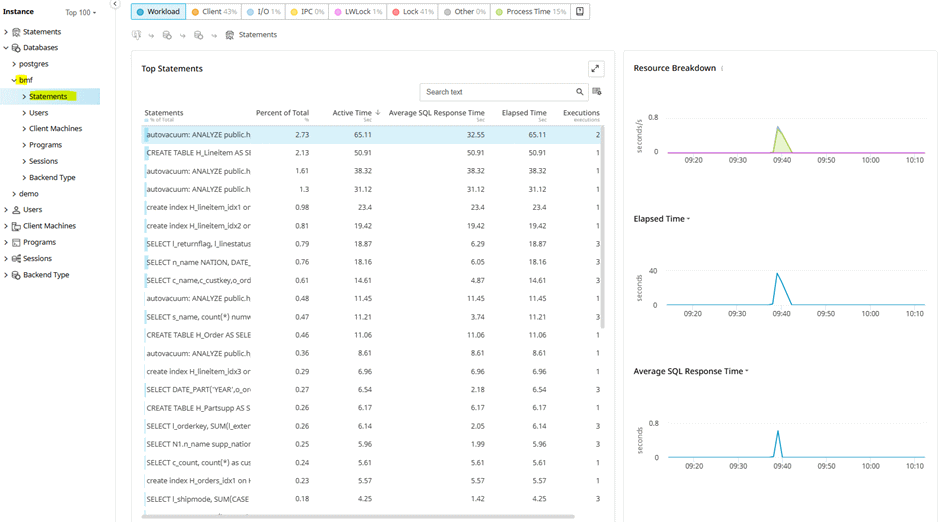
And if I click on the bmf database:
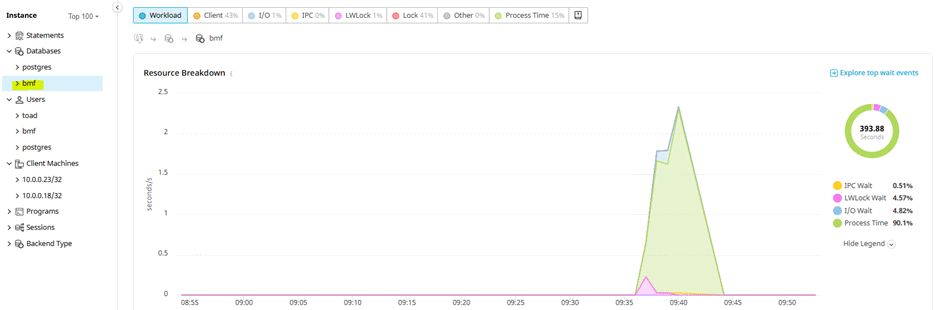
It’s this database that has the Process Time and a bit of LWLockWait and I/O wait.
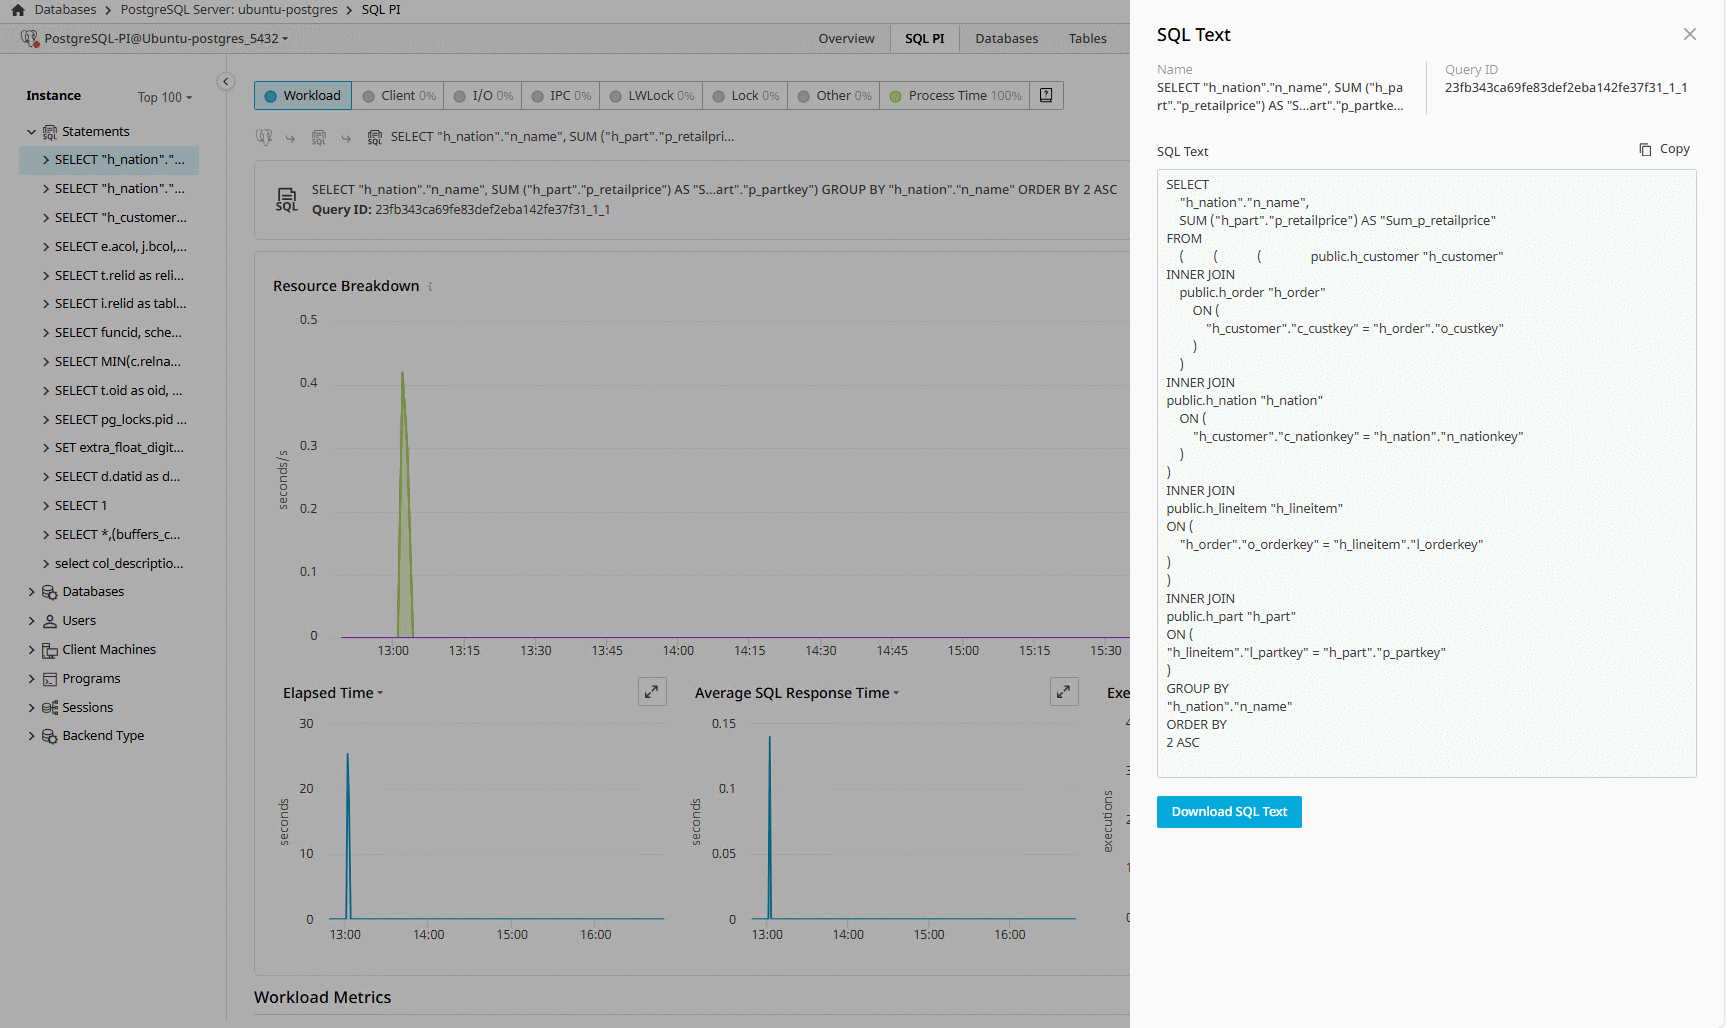
And I can then see which statements are contributing to this by drilling in further:
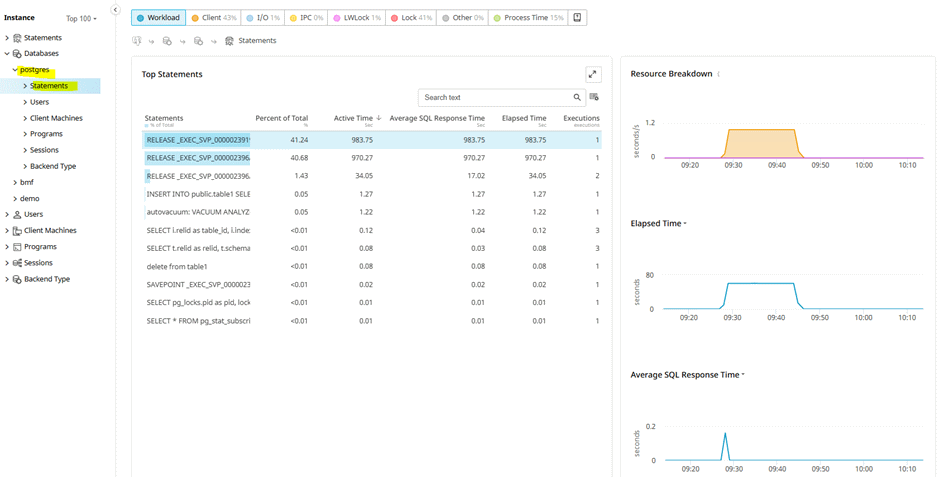
You could also drill into a SQL statement for more detail:
And the same view for the bmf database:
Also, if in a particular database we had a more varied list of wait events, we can click the resource type at the top of the dashboard and focus on I/O or Lock wait for example.
This information is collected remotely and stored in Foglight with 12 months of data, so if you have an issue over the weekend, or last week while you were away, you can still go back and follow up on the problem.
And even better, if you have a lot of instances to manage, the Query Insights feature will allow you to focus on the queries with the most impact and quickly identify which instance is impacted:
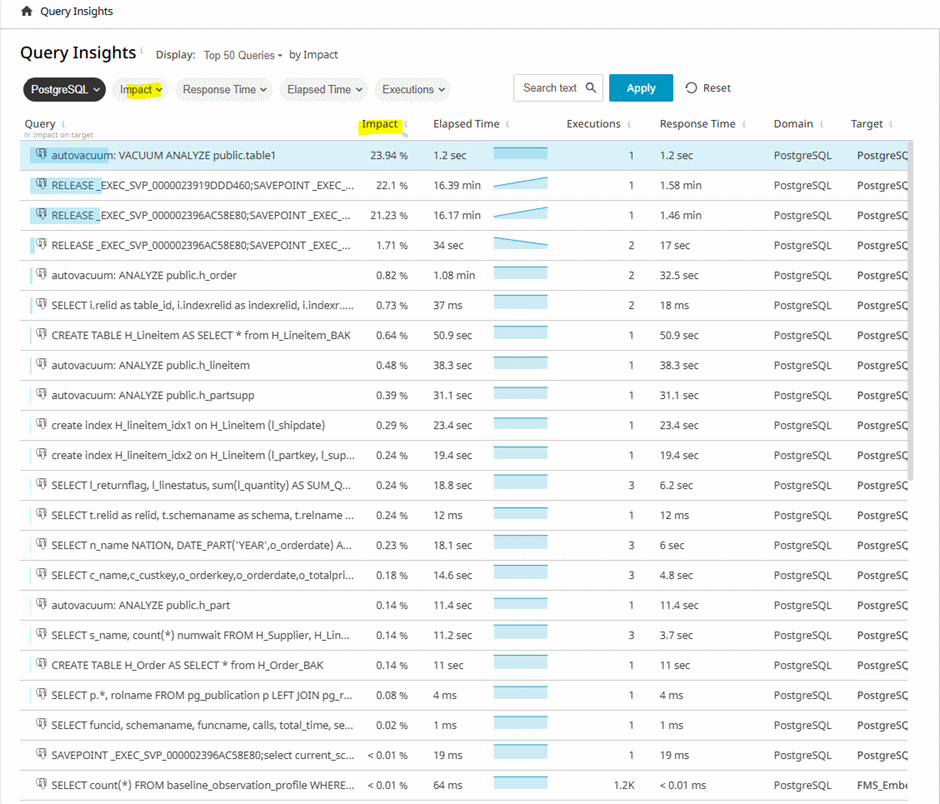
Click here for further information: https://www.quest.com/products/foglight-cloud
